
How to use mixed methods in ATLAS.ti
Key takeaways
- Mixed methods research combines qualitative and quantitative research approaches in a single study.
- Researchers use mixed methods to gain a more complete understanding of a research problem by integrating numerical and non-numerical data.
- ATLAS.ti supports mixed methods workflows by helping researchers organize, code, analyze, compare, visualize, and report multiple types of data.
- Researchers can work with interviews, documents, survey responses, images, audio, video, and quantitative datasets in the same project.
- Mixed methods research requires intentional integration of qualitative and quantitative findings rather than simply collecting different types of data.
- Common mixed methods designs include convergent, explanatory sequential, and exploratory sequential designs.
Who this article is for
This article is for researchers, students, instructors, evaluators, and analysts who want to use mixed methods research in ATLAS.ti to combine qualitative and quantitative data within a single research project.

What is mixed methods research?
Mixed methods research combines qualitative and quantitative research approaches in a single study. Researchers integrate qualitative and quantitative data to better understand a research problem or phenomenon.
Qualitative research focuses on:
- meanings
- experiences
- perceptions
- behaviors
- contexts
- interpretations
Quantitative research focuses on:
- numerical measurement
- variables
- statistical analysis
- comparisons
- frequencies
- relationships between variables
Mixed methods research combines the strengths of both approaches to answer questions that may not be fully addressed by qualitative or quantitative methods alone.
For example, researchers may:
- use surveys to measure patterns quantitatively
- use interviews to explore participant experiences qualitatively
- compare statistical findings with coded themes
- integrate observations with survey data
- combine open-ended and closed-ended responses
Mixed methods research is not simply about collecting more data. It involves intentionally integrating qualitative and quantitative findings throughout the research process.
Common mixed methods research designs
Different mixed methods designs determine how researchers collect, analyze, and integrate data.
Convergent design
In a convergent design:
- qualitative and quantitative data are collected at the same time
- both datasets are analyzed separately
- the results are then compared and integrated
Researchers often use convergent designs when they want to compare different perspectives on the same phenomenon.
Explanatory sequential design
In an explanatory sequential design:
- quantitative data is collected and analyzed first
- qualitative data is collected afterward to explain or interpret the quantitative findings
For example:
- a survey may identify trends
- interviews may explain why those trends occurred
Exploratory sequential design
In an exploratory sequential design:
- qualitative data is collected and analyzed first
- quantitative research is developed afterward based on the qualitative findings
For example:
- interviews may identify themes
- the themes may later be used to create a survey instrument
Embedded design
Embedded designs include one type of data within another larger research design.
For example:
- a qualitative interview component may be embedded within a quantitative experiment
- survey data may support a primarily qualitative study
How to plan a mixed methods research project
Mixed methods research requires careful planning to ensure qualitative and quantitative approaches complement each other effectively.
Step 1: Define the research problem
Start by identifying:
- what you want to study
- why both qualitative and quantitative approaches are needed
- what each type of data will contribute
Examples:
- How do students experience online learning, and how satisfied are they overall?
- How do healthcare workers describe workplace stress, and how frequently do stress factors occur?
- How do customers evaluate a product statistically, and what experiences shape those evaluations?
Step 2: Choose a mixed methods design
Select the design that best supports your research goals.
Consider:
- whether qualitative and quantitative data will be collected simultaneously or sequentially
- how the datasets will be integrated
- whether one method will have greater emphasis
- how findings will be interpreted together
Step 3: Collect qualitative and quantitative data
Mixed methods studies often combine:
- interviews
- focus groups
- open-ended survey responses
- structured surveys
- observations
- field notes
- documents
- multimedia materials
- demographic or statistical datasets
ATLAS.ti supports multiple data types in the same project, including text, images, audio, video, and structured survey data.

How to use mixed methods workflows in ATLAS.ti
ATLAS.ti supports mixed methods research by helping researchers organize, code, compare, visualize, and interpret multiple forms of data.
Step 1: Import different types of data
- Create a new project.
- Add your qualitative materials.
- Organize documents if needed.
Researchers commonly import:
- interview transcripts
- survey responses
- PDFs
- field notes
- spreadsheets
- images
- audio recordings
- video recordings
Step 2: Code qualitative data
Coding helps researchers label and organize meaningful data segments.
Researchers may:
- create deductive codes based on survey variables or theoretical frameworks
- create inductive codes from interview responses
- compare codes across participant groups
- organize codes into categories and subcodes
Coding may help researchers connect qualitative findings with quantitative patterns.
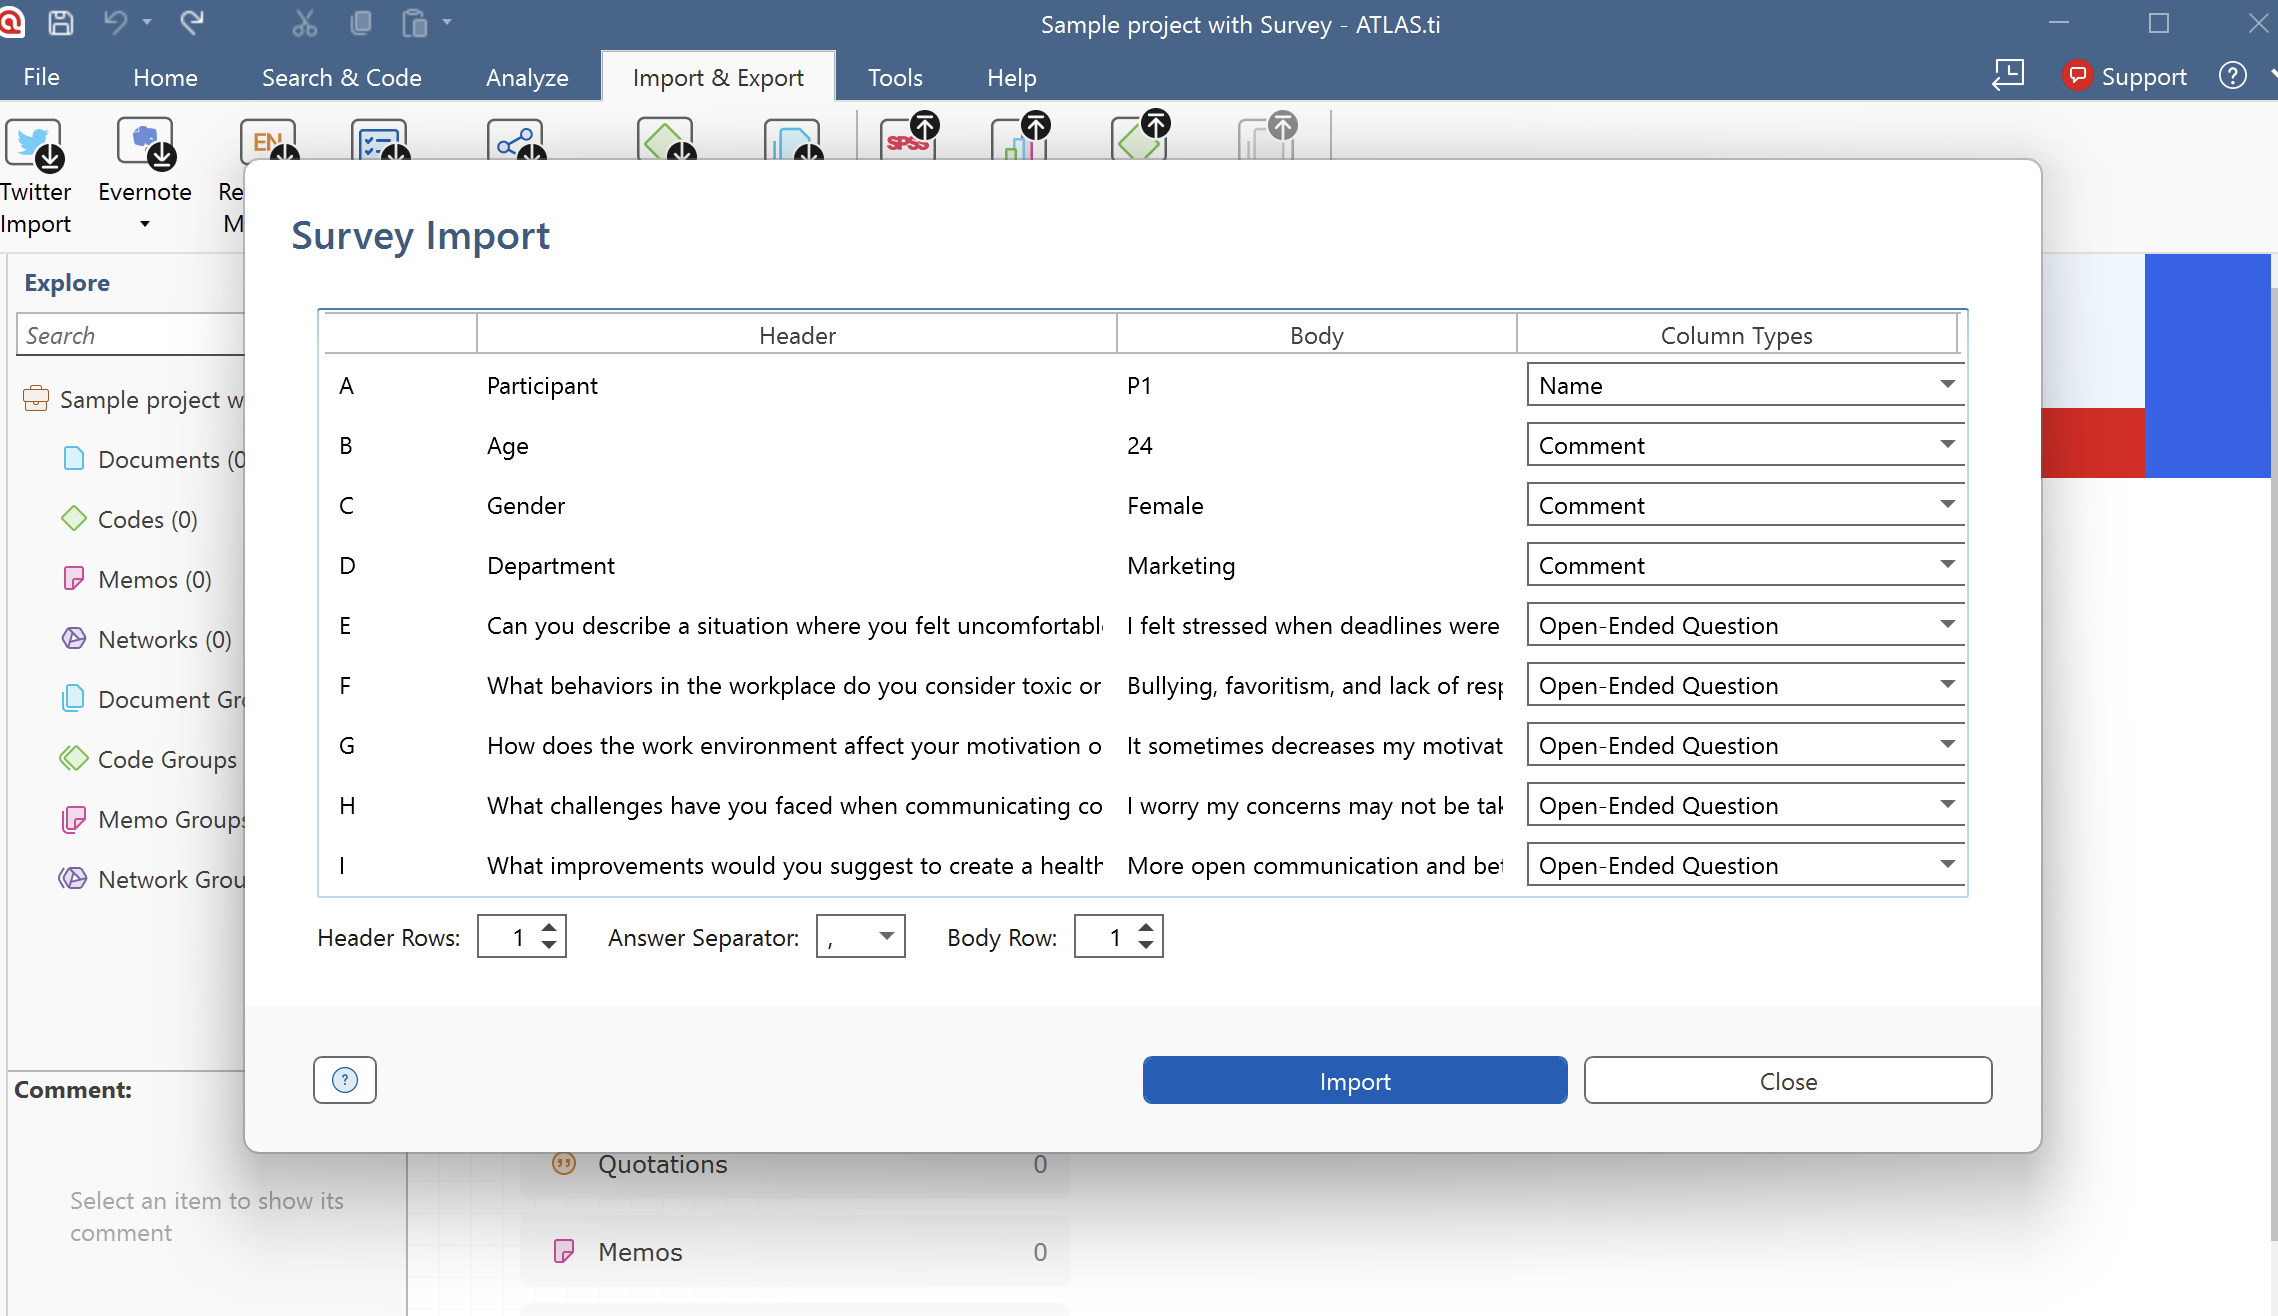
Step 3: Work with survey data
Mixed methods projects often combine:
- closed-ended survey questions
- open-ended responses
- demographic variables
- coded qualitative responses
Researchers can:
- analyze open-ended survey responses qualitatively
- compare coded themes across survey groups
- integrate survey variables with qualitative coding
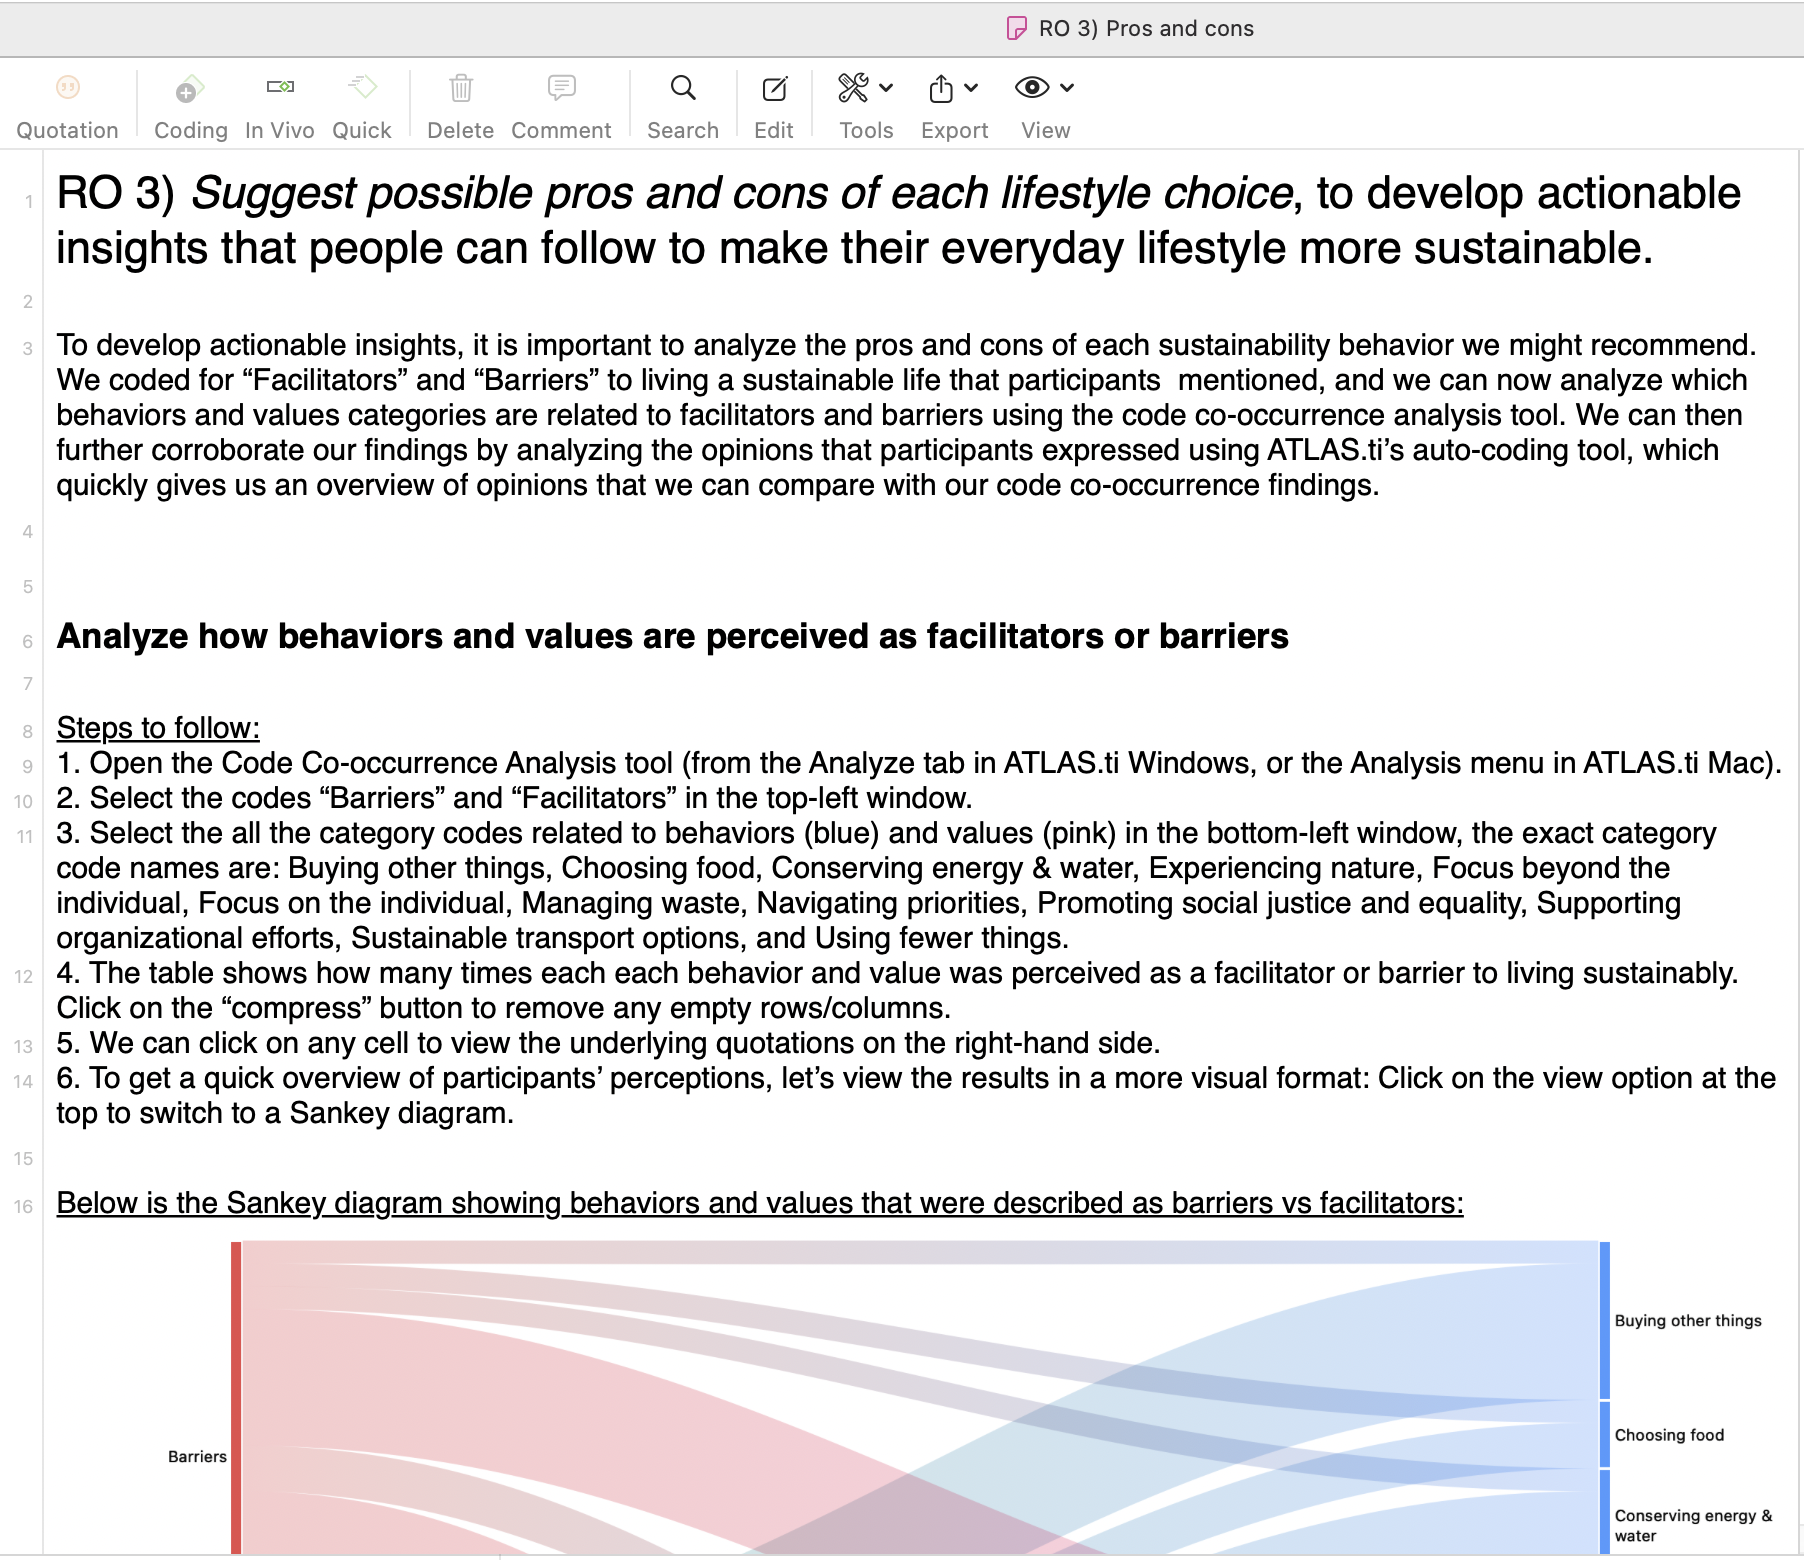
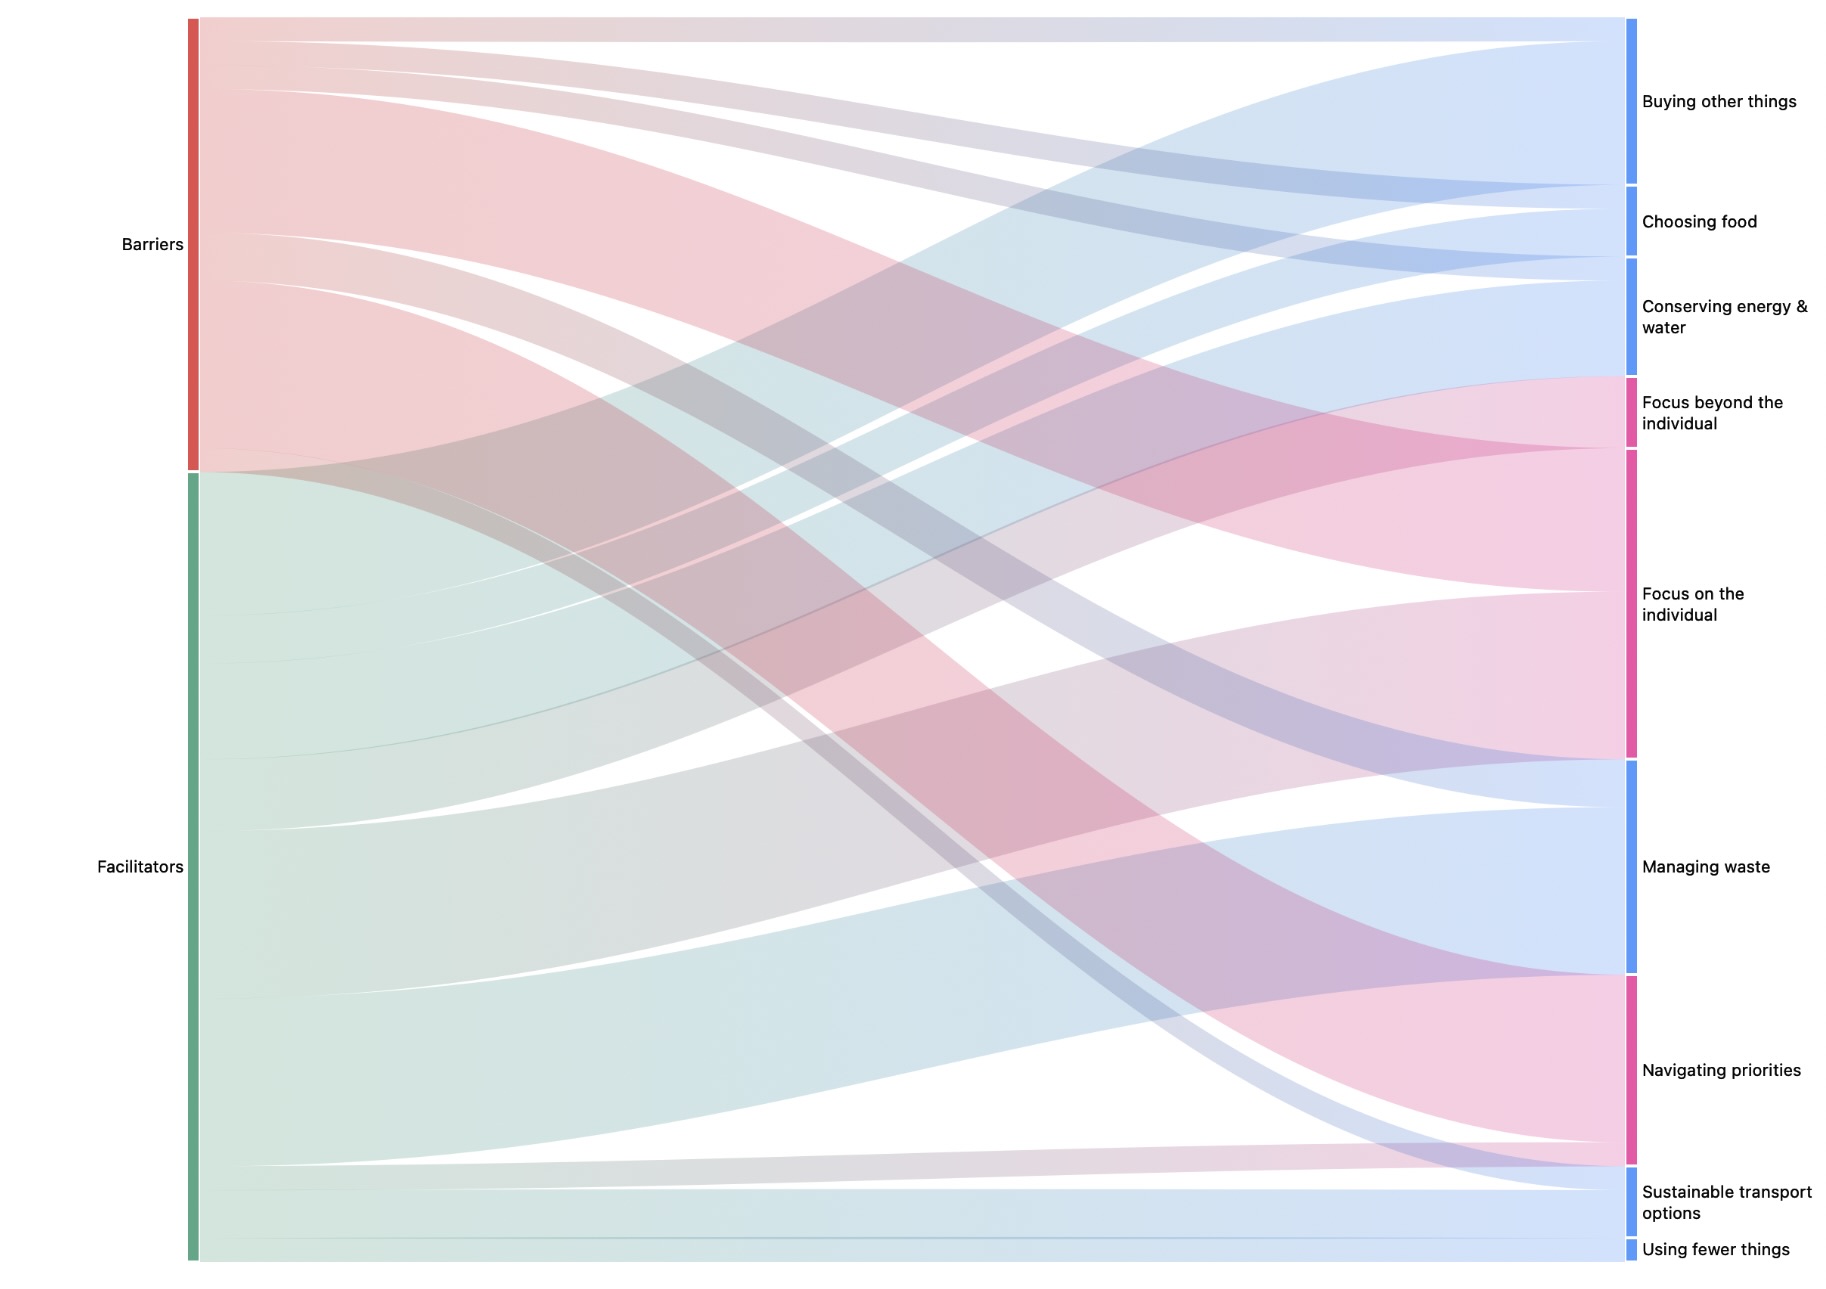
Step 4: Compare and integrate findings
Integration is one of the most important parts of mixed methods research.
Researchers may compare:
- themes across participant groups
- qualitative findings with survey results
- coded responses across demographic variables
- quantitative trends with interview narratives
ATLAS.ti tools such as code-document analysis, code co-occurrence analysis, and networks can help researchers compare patterns and relationships across datasets.

Step 5: Write memos and analytic reflections
Memos help researchers document:
- methodological decisions
- integration strategies
- emerging interpretations
- relationships between datasets
- explanations for findings
Researchers often use memos to explain how qualitative and quantitative findings relate to each other.
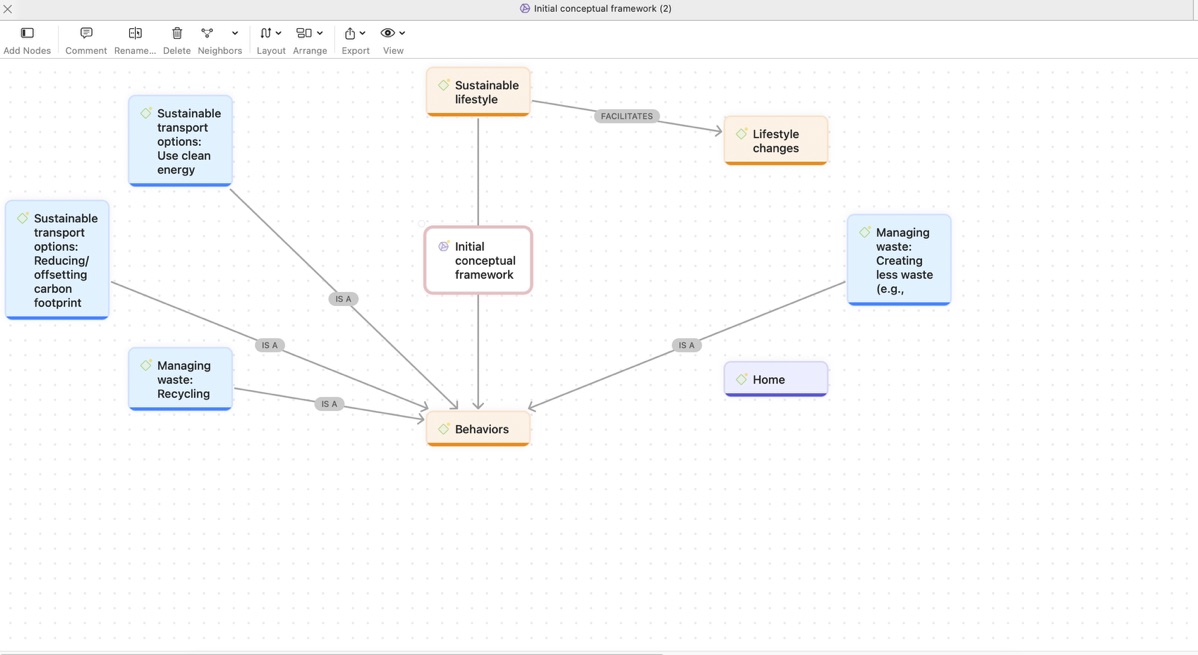
Step 6: Visualize relationships and patterns
ATLAS.ti includes visualization tools that help researchers explore:
- relationships between concepts
- patterns across groups
- connections between qualitative and quantitative findings
- theoretical models and frameworks
Researchers can use:
- networks
- tables
- reports
- analysis tools
- visual comparisons
Step 7: Export reports and findings
Researchers can export:
- quotations
- codebooks
- reports
- tables
- visualizations
- coded survey results
These outputs can support:
- publications
- dissertations
- presentations
- team collaboration
- mixed methods reporting
How to integrate qualitative and quantitative findings
Integration is central to mixed methods research.
Researchers may integrate findings by:
- comparing qualitative themes with statistical patterns
- explaining quantitative results through interviews
- validating findings across methods
- identifying contradictions or differences between datasets
- building a more comprehensive interpretation
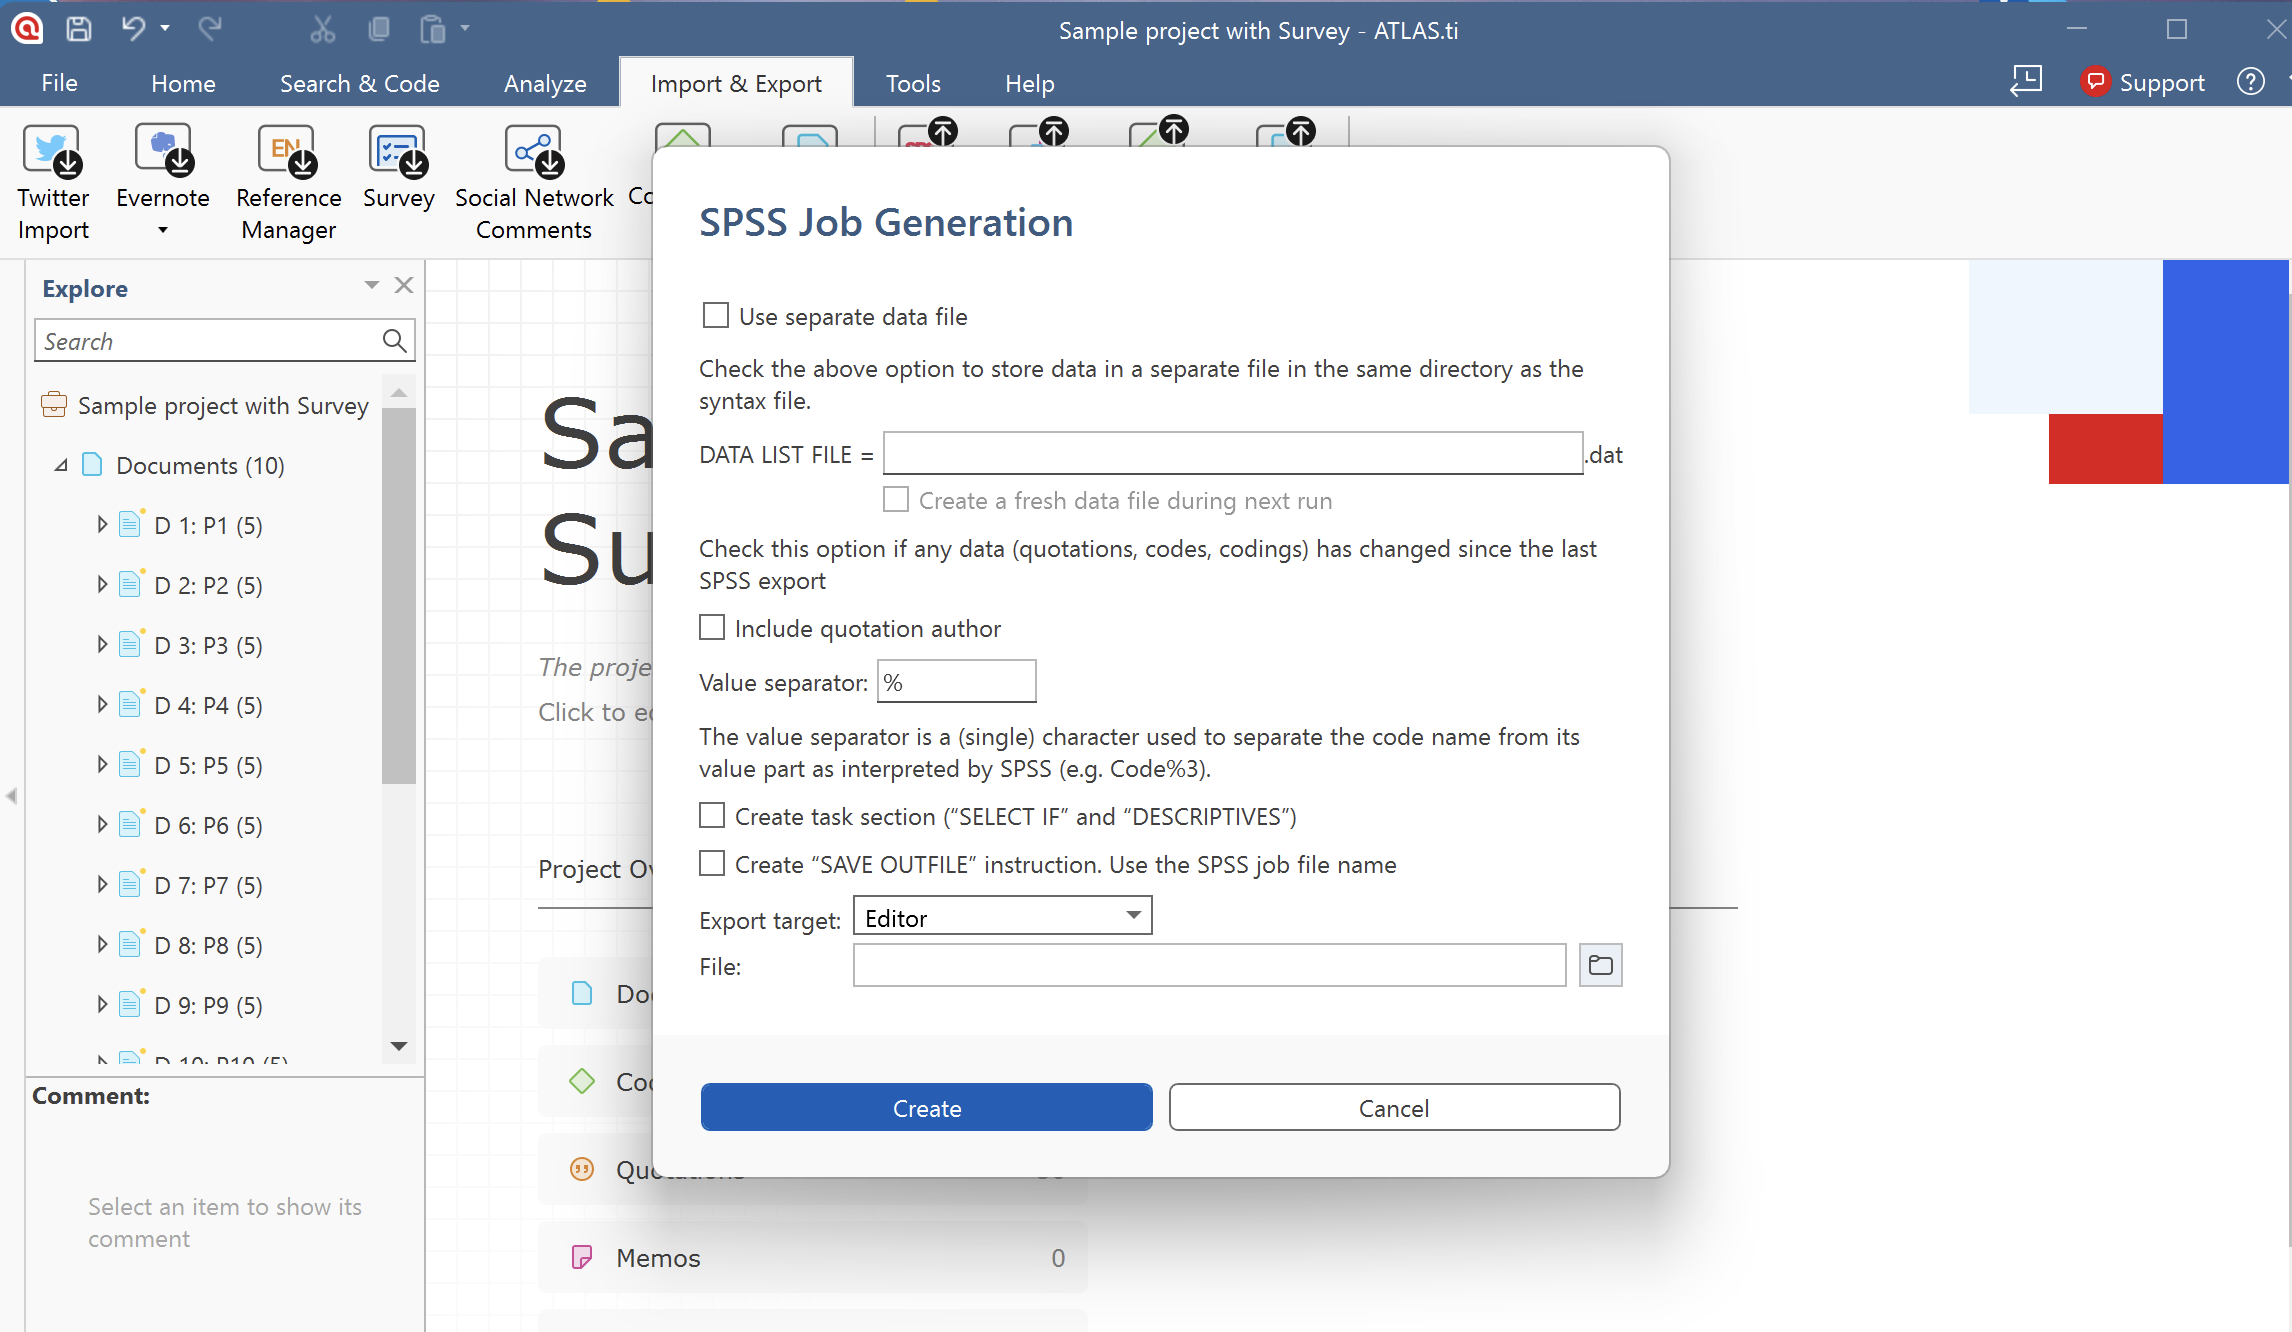
ATLAS.ti Desktop projects can be exported for further statistical analysis, making it possible to combine qualitative coding with quantitative methods.
- Exported data can be opened in Excel, SPSS/PSPP, or other statistical software such as R, SAS, or STATA for additional analysis.
- In these exports, quotations become cases (rows), while codes and code groups become variables (columns), allowing you to analyze coding frequencies, compare groups, and run statistical tests.
- Additional variables such as document name, document number, quotation position, and creation date are also included, making it easier to aggregate or filter data during quantitative analysis.
Advantages of mixed methods research
Mixed methods research can help researchers:
- gain deeper insight into complex problems
- combine statistical trends with participant experiences
- validate findings across multiple data sources
- improve interpretation and contextual understanding
- strengthen theory development
- address research questions more comprehensively
Common issues and mistakes
- Collecting qualitative and quantitative data without integration
- Mixed methods research requires intentional integration of findings, not simply multiple forms of data collection.
- Choosing a mixed methods design without clear research goals
- The research question should guide:
- the design
- the sequence of methods
- the type of data collected
- the integration strategy
- The research question should guide:
- Treating qualitative and quantitative findings as separate studies
- The goal of mixed methods research is to connect and interpret findings together.
- Using too many unrelated variables or codes
- Large mixed datasets can become difficult to manage without a clear analytic structure.
- Skipping memo writing and documentation
- Memos help researchers document methodological decisions and explain how findings were integrated.
When to contact support
Contact ATLAS.ti Support if:
- projects do not open correctly
- imported survey data is missing or incomplete
- coding features are not working as expected
- analysis tools fail to generate results
- reports or exports fail
- networks or visualizations do not display correctly
- the project behaves differently from the documentation
When contacting support, include:
- your platform: Web, Windows, or Mac
- your ATLAS.ti version if using Desktop
- screenshots or error messages
- a short description of your workflow
- the types of data included in the project