
How to analyze survey data with ATLAS.ti
Key Takeaways
- Survey data can include both closed-ended responses and open-ended responses.
- Closed-ended questions are usually analyzed quantitatively, while open-ended responses can be analyzed qualitatively in ATLAS.ti.
- ATLAS.ti helps you organize, code, compare, and visualize survey responses.
- You can analyze survey data in ATLAS.ti Windows, Mac, and Web.
- AI tools, auto coding, sentiment analysis, code tables, and visualizations can help identify patterns and insights in open-ended survey data.
Who this article is for
Anyone who wants to analyze survey responses in ATLAS.ti, especially open-ended answers, customer feedback, questionnaire responses, or mixed-methods survey data.
How survey data analysis works
- Surveys usually ask the same questions to multiple respondents, which makes the responses easier to compare across participants. Survey data may include closed-ended questions, such as multiple choice or Likert scale items, and open-ended questions where respondents answer in their own words.
- Closed-ended responses are often analyzed with descriptive statistics or statistical software. Open-ended responses, however, require qualitative analysis because they contain explanations, opinions, experiences, and suggestions that need to be coded and interpreted.
- In ATLAS.ti, you can analyze open-ended survey responses by organizing your data, coding responses, comparing codes across respondents, and visualizing patterns.
How to prepare survey data for ATLAS.ti
Before importing survey data, make sure your spreadsheet is clearly structured:
- Each row should represent one respondent or survey response.
- Each column should represent one survey question.
- Open-ended questions should contain the answers you want to code.
- Demographic or closed-ended questions can be used for grouping and comparison.
- Remove columns you do not need before importing.
If your survey tool uses more than one header row, make sure this is adjusted during import so ATLAS.ti can read the file correctly.
How to import and organize survey data
In ATLAS.ti Windows or Mac:
- Select the Import Survey option
- In Windows, go to the Import & Export tab

b. In Mac, go to the Document menu > Import
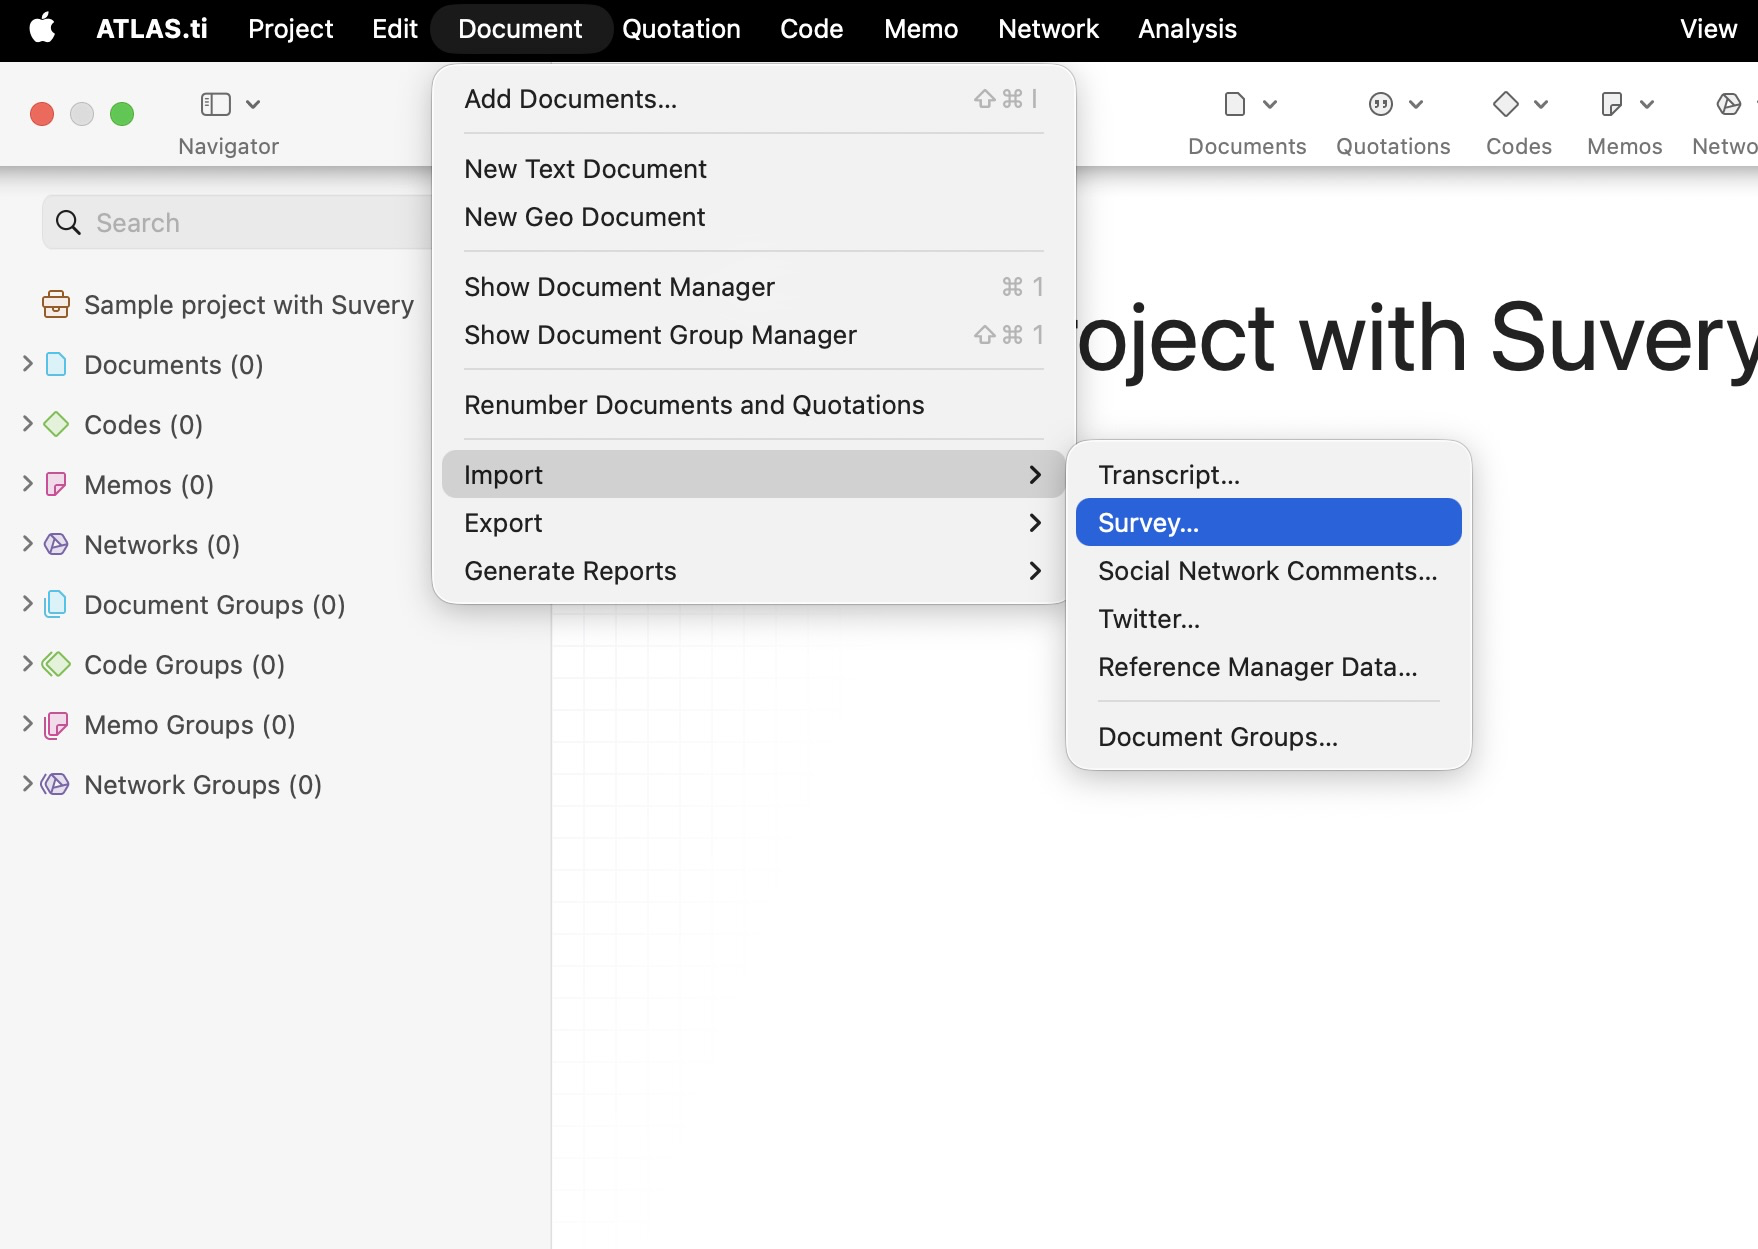
- Select your Excel file and click Open.
- Follow the import wizard to define how each column should be handled (for example, what information should be used to organize document groups and what information should be added as coded content of each document).
In ATLAS.ti Web:
- Click Add Document.
- Select CSV Survey Data.
- Upload a CSV (.csv) file (save or export your Excel file as CSV first).

- Choose which columns (questions) and rows (responses) to import. Each row will become a separate document.
- If the goal is to keep all attributes within the same document, the Survey tool works well. However, if you need to organize documents into document groups, this has to be done manually in ATLAS.ti Web. You can auto-code for each participant's attributes and then filter by that code to create document groups accordingly.
How to code open-ended survey response
- When importing survey data, ATLAS.ti desktop ( Windows and Mac) allows you to define columns as Open-Ended Questions during the import process.
- For columns imported as Open-Ended Questions:
- The answers become the primary document content for qualitative analysis.
- ATLAS.ti automatically creates quotations from each answer.
- Each answer is automatically coded using the corresponding survey question or column heading.
- This helps organize responses by survey question before beginning deeper thematic coding and analysis.
- After import, you can review, refine, merge, rename, or reorganize the automatically generated codes and continue developing your own analytical codes and themes.
- For columns imported as Open-Ended Questions:
- In ATLAS.ti Web, survey data can be imported from a CSV file. Each row is imported as a separate document, and each column typically represents a survey question. After import, you can manually code open-ended responses or use tools such as AI Coding, AI Coding with Intention or Search and Auto-Code to help.
How to compare survey responses
After coding your survey data, you can compare responses across different respondent groups using the Code-Document Analysis tool. This tool shows how often selected codes appear in selected documents or document groups, making it useful for comparing patterns between groups.
For survey analysis, this is especially helpful when your closed-ended or demographic survey answers were imported as document groups, while your open-ended answers were coded qualitatively.
- In ATLAS.ti Windows and Mac
- Open the Code-Document Analysis tool.
- In ATLAS.ti Windows, open it from the Analyze tab.
- In ATLAS.ti Mac, open it from the Analysis menu.
- Select the codes or subcodes you want to compare. For example, select codes related to practical recommendations, such as Managing waste, Sustainable transport options, and Change factors.
- Select the document groups you want to compare. For example:
- Interviews: Experts
- Interviews: Laypeople
- Review the table.The table shows how often each selected code appears in each document group.
- Click a table cell to inspect the underlying quotations.This allows you to check the actual responses behind the numbers and confirm how participants discussed the topic.
- If your groups are different sizes, normalize the results.For example, if you interviewed more laypeople than experts, absolute frequencies may be misleading. Use Options/Settings > Normalize to make the groups easier to compare.

- Use column-relative frequencies to identify what each group emphasized most.Select Options/settings > Column-relative frequencies to see which codes were most common within each group.
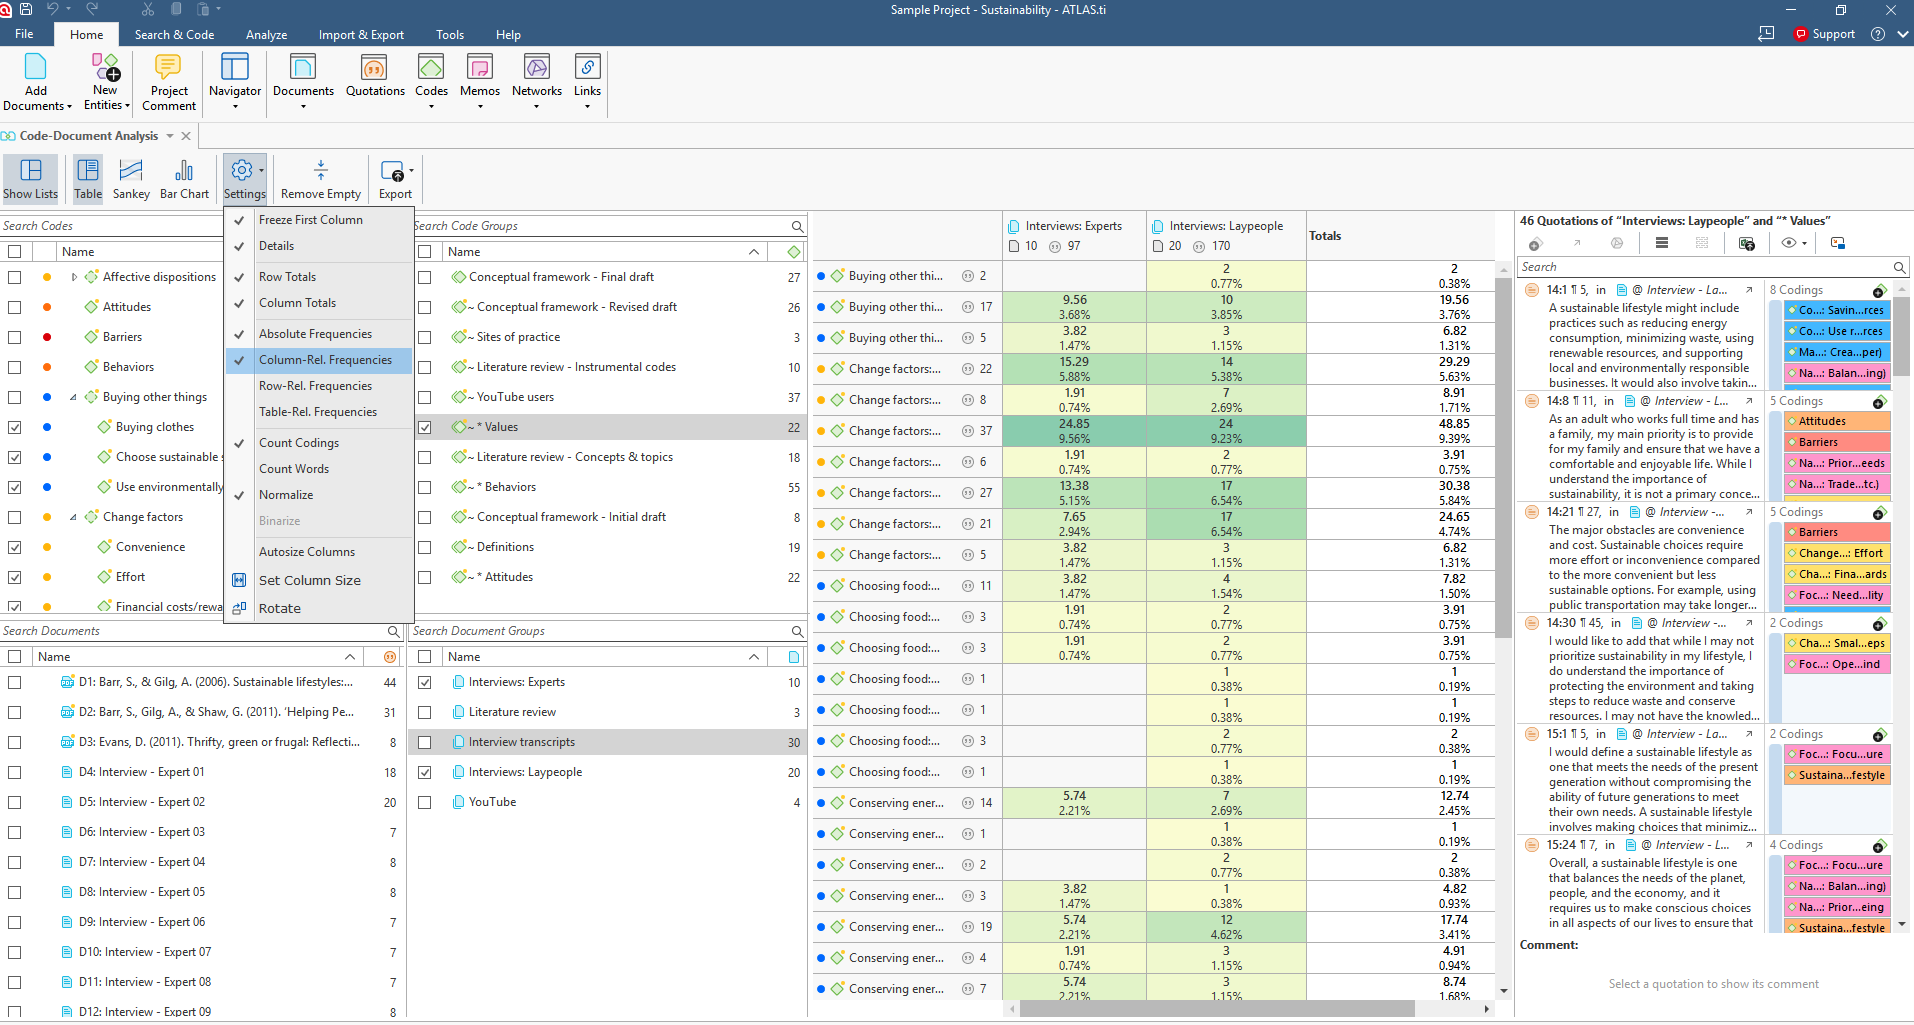
- Visualize the results as a Sankey diagram or chart from the view menu. To export as image, click on "Export" option.
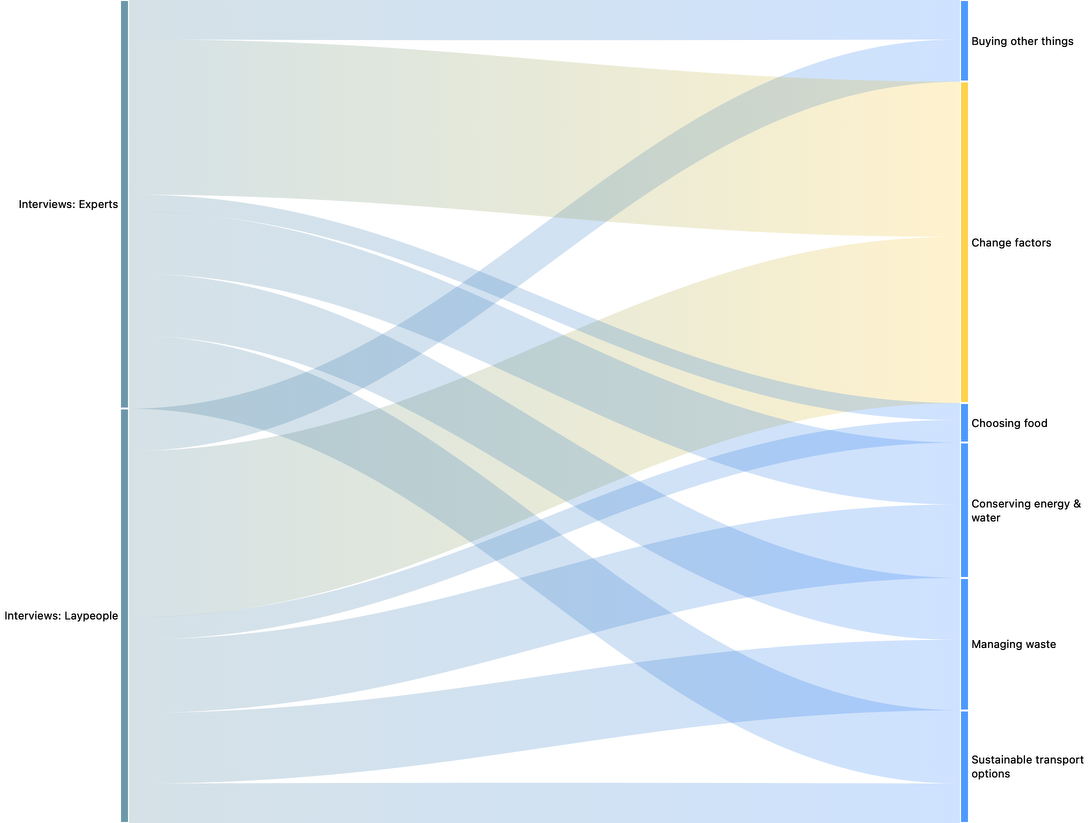
In this example, we compare recommendations made by experts and laypeople about sustainable living. The researcher selected codes related to practical recommendations, such as:
- Conserving energy and water
- Managing waste
- Sustainable transport options
- Choosing food
- Buying other things
- Change factors
Then they compared these codes across two document groups:
- Interviews: Experts
- Interviews: Laypeople
In this example, the Code-Document Analysis showed that both experts and laypeople frequently discussed financial costs and rewards as important factors in sustainable living.
However, the comparison also showed differences between the groups:
- Experts mentioned recycling and public transportation more often.
- Laypeople focused more on information, awareness, and public infrastructure.
This suggests that both groups agree that cost matters, but they emphasize different types of practical support. Experts focus more on specific sustainable behaviors, while laypeople emphasize the conditions that make sustainable behavior easier.
This kind of comparison can help researchers move from coded survey responses to meaningful findings. For example, the results may suggest that policy makers should not only promote recycling or public transportation, but also improve public awareness and infrastructure so people can act on those recommendations.
- In ATLAS.ti Web
- Go to the View section by clicking the bar chart icon on the left side of the page.
- Click New View and select Code-Document Table.
- Then, choose the desired Code/Code Group and Document/Document Group.
- You can change the display of the results between Table view and Sankey view.

- To export the results to Excel, switch to the table display, select the desired columns, and click the download arrow to export the file in Excel format.
- If you would like to save the Sankey diagram as an image, you will need to take a screenshot of the display, as exporting the Sankey view directly as an image is currently not supported.
Common issues and mistakes
- Unsupported file format
- Windows and Mac support only Excel files (.xlsx)
- Web supports only CSV files (.csv)
- Files not structured correctly
- If the spreadsheet is not prepared according to the recommended workflow (for example, one row per participant with clear column headers), the Survey Import or Document Groups Import may fail or produce unexpected results.
- Comparing groups with different sample sizes without normalizing
- If one group has more respondents than another, absolute frequencies can be misleading. Use Normalize or Column-relative frequencies to compare groups more fairly.
- Forgetting to use document groups
- To compare groups such as experts vs laypeople, students vs teachers, or different demographic groups, make sure your survey responses are organized into document groups first.
When to contact support
Contact ATLAS.ti Support if:
- You cannot import or organize your survey data.
- Survey responses do not appear as expected after import.
- Codes, document groups, or metadata are not behaving as expected.
- You experience errors while coding, comparing, or exporting survey results.
When contacting support, please include:
- Your ATLAS.ti version.
- Your operating system or whether you are using ATLAS.ti Web.
- The survey file format you are using.
- A description of your workflow.
- Screenshots or error messages, if available.