
How to use the code co-occurrence tool
Key takeaways
- The Code Co-occurrence tool helps you explore how codes relate to each other in your data.
- It shows where two codes were applied to the same quotation or overlapping quotations.
- Results can be viewed as a table, Sankey diagram, bar chart, or force-directed graph.
- You can click any result to inspect the original quotations in context.
- Available in ATLAS.ti Windows, Mac, and Web.
Who this article is for
This article is for researchers and analysts who want to explore relationships between themes, concepts, or topics in coded qualitative data.
What is the code co-occurrence tool?
The Code Co-occurrence tool helps you analyze where codes appear together in your data. It is commonly used to identify relationships between themes, concepts, behaviors, opinions, or patterns across interviews, documents, survey responses, and other qualitative materials.
The tool compares pairs of codes and displays how often they co-occur. Co-occurrence means that two codes were applied either:
- to the same quotation, or
- to overlapping quotations.
For example, if the codes “Productivity” and “Flexibility” co-occur five times, this means there are five places in the project where those topics were discussed together.
The results depend on how your data has been coded.
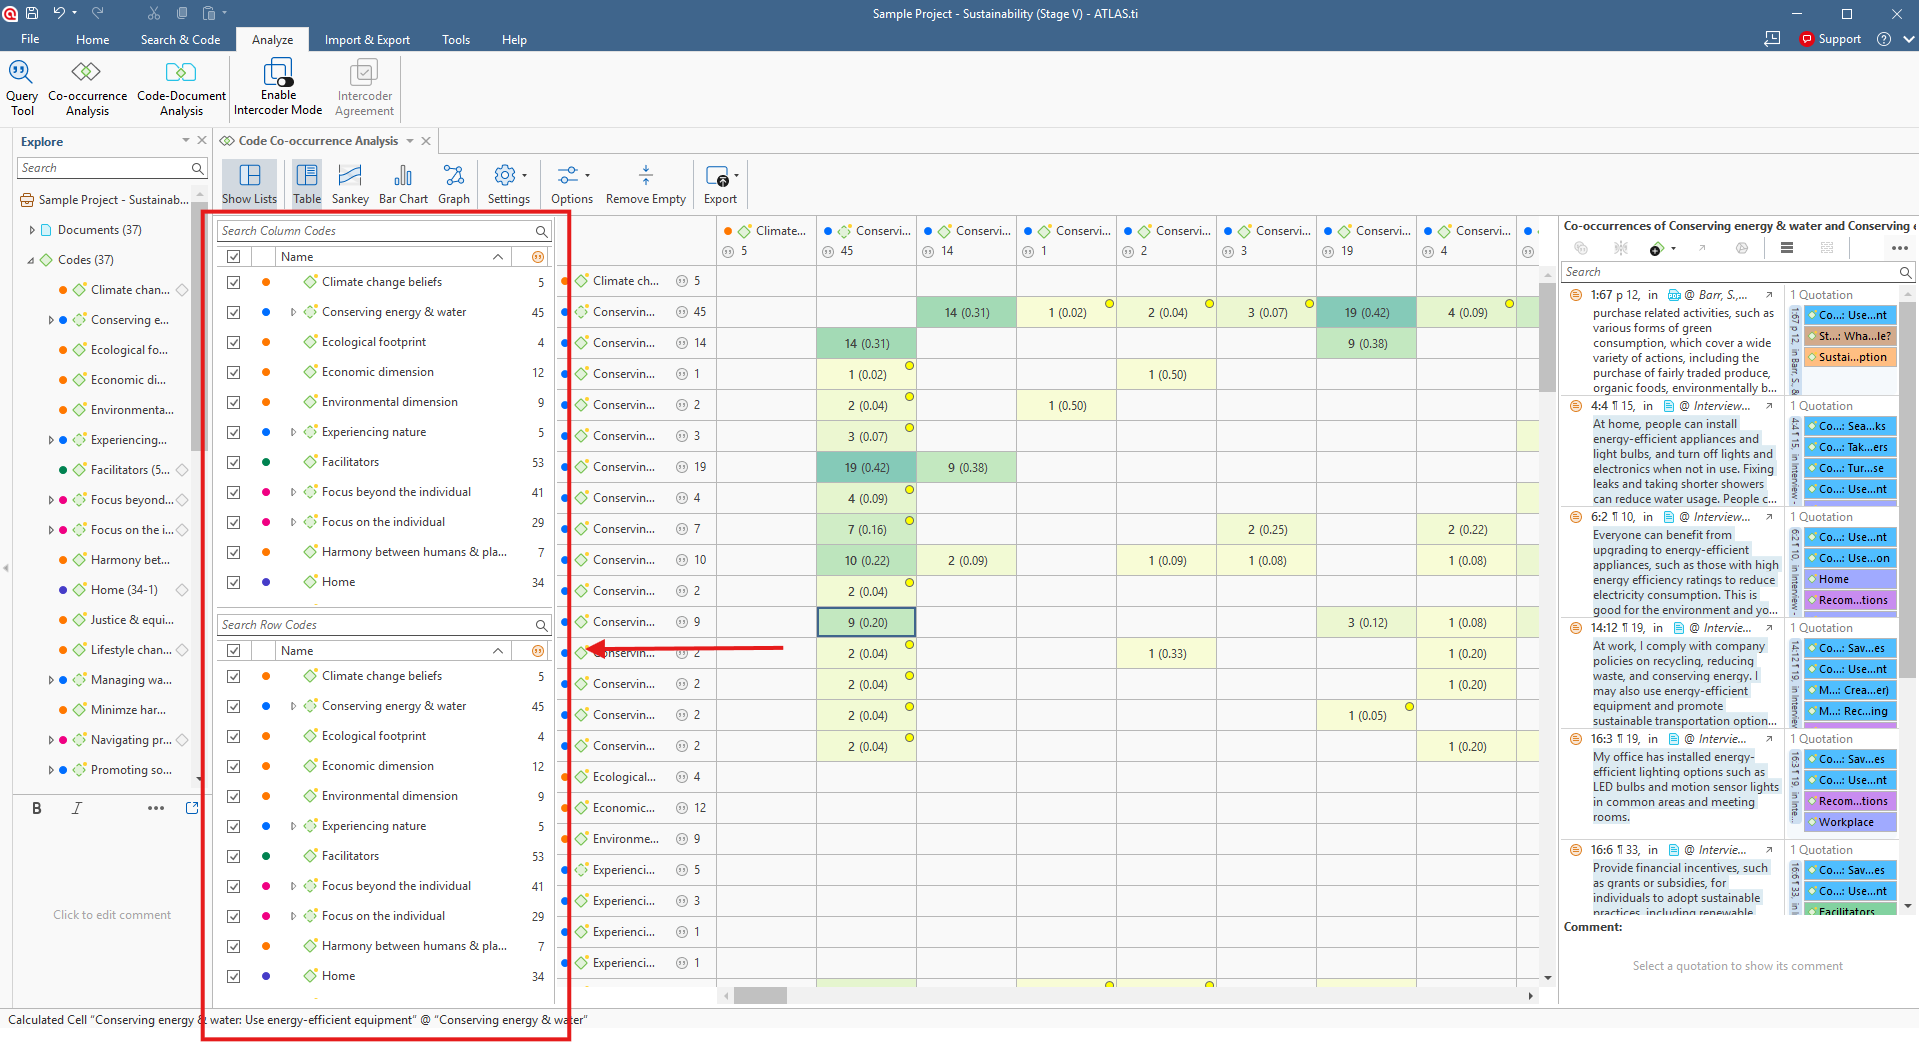
Open the Code Co-occurrence tool
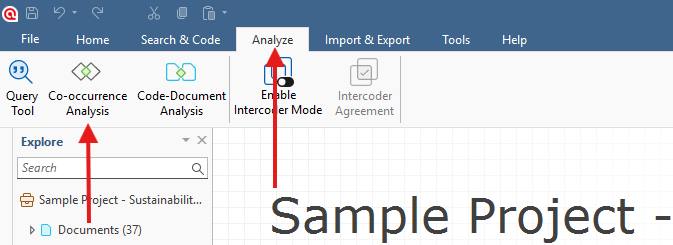
ATLAS.ti Windows: Go to the Analyze tab and select Co-Occurrence Analysis.
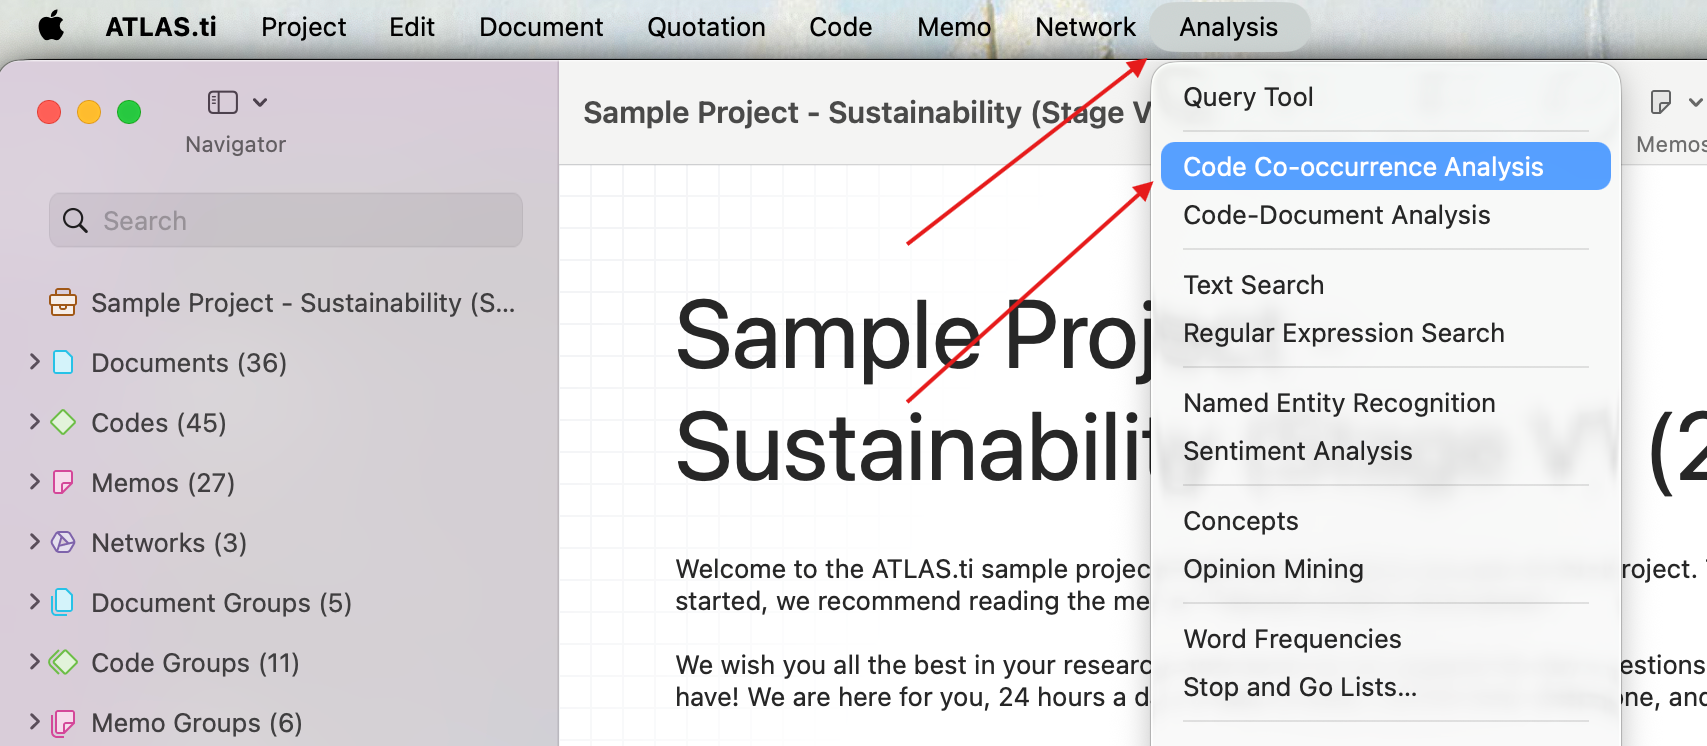
ATLAS.ti Mac: Go to Analysis > Code Co-occurrence Table.
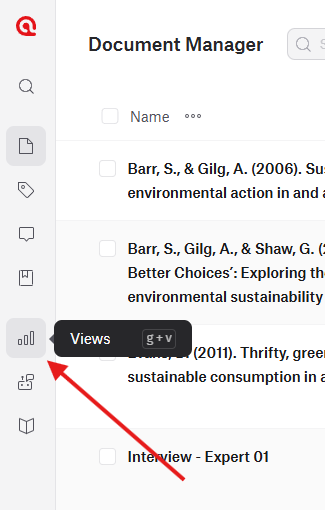
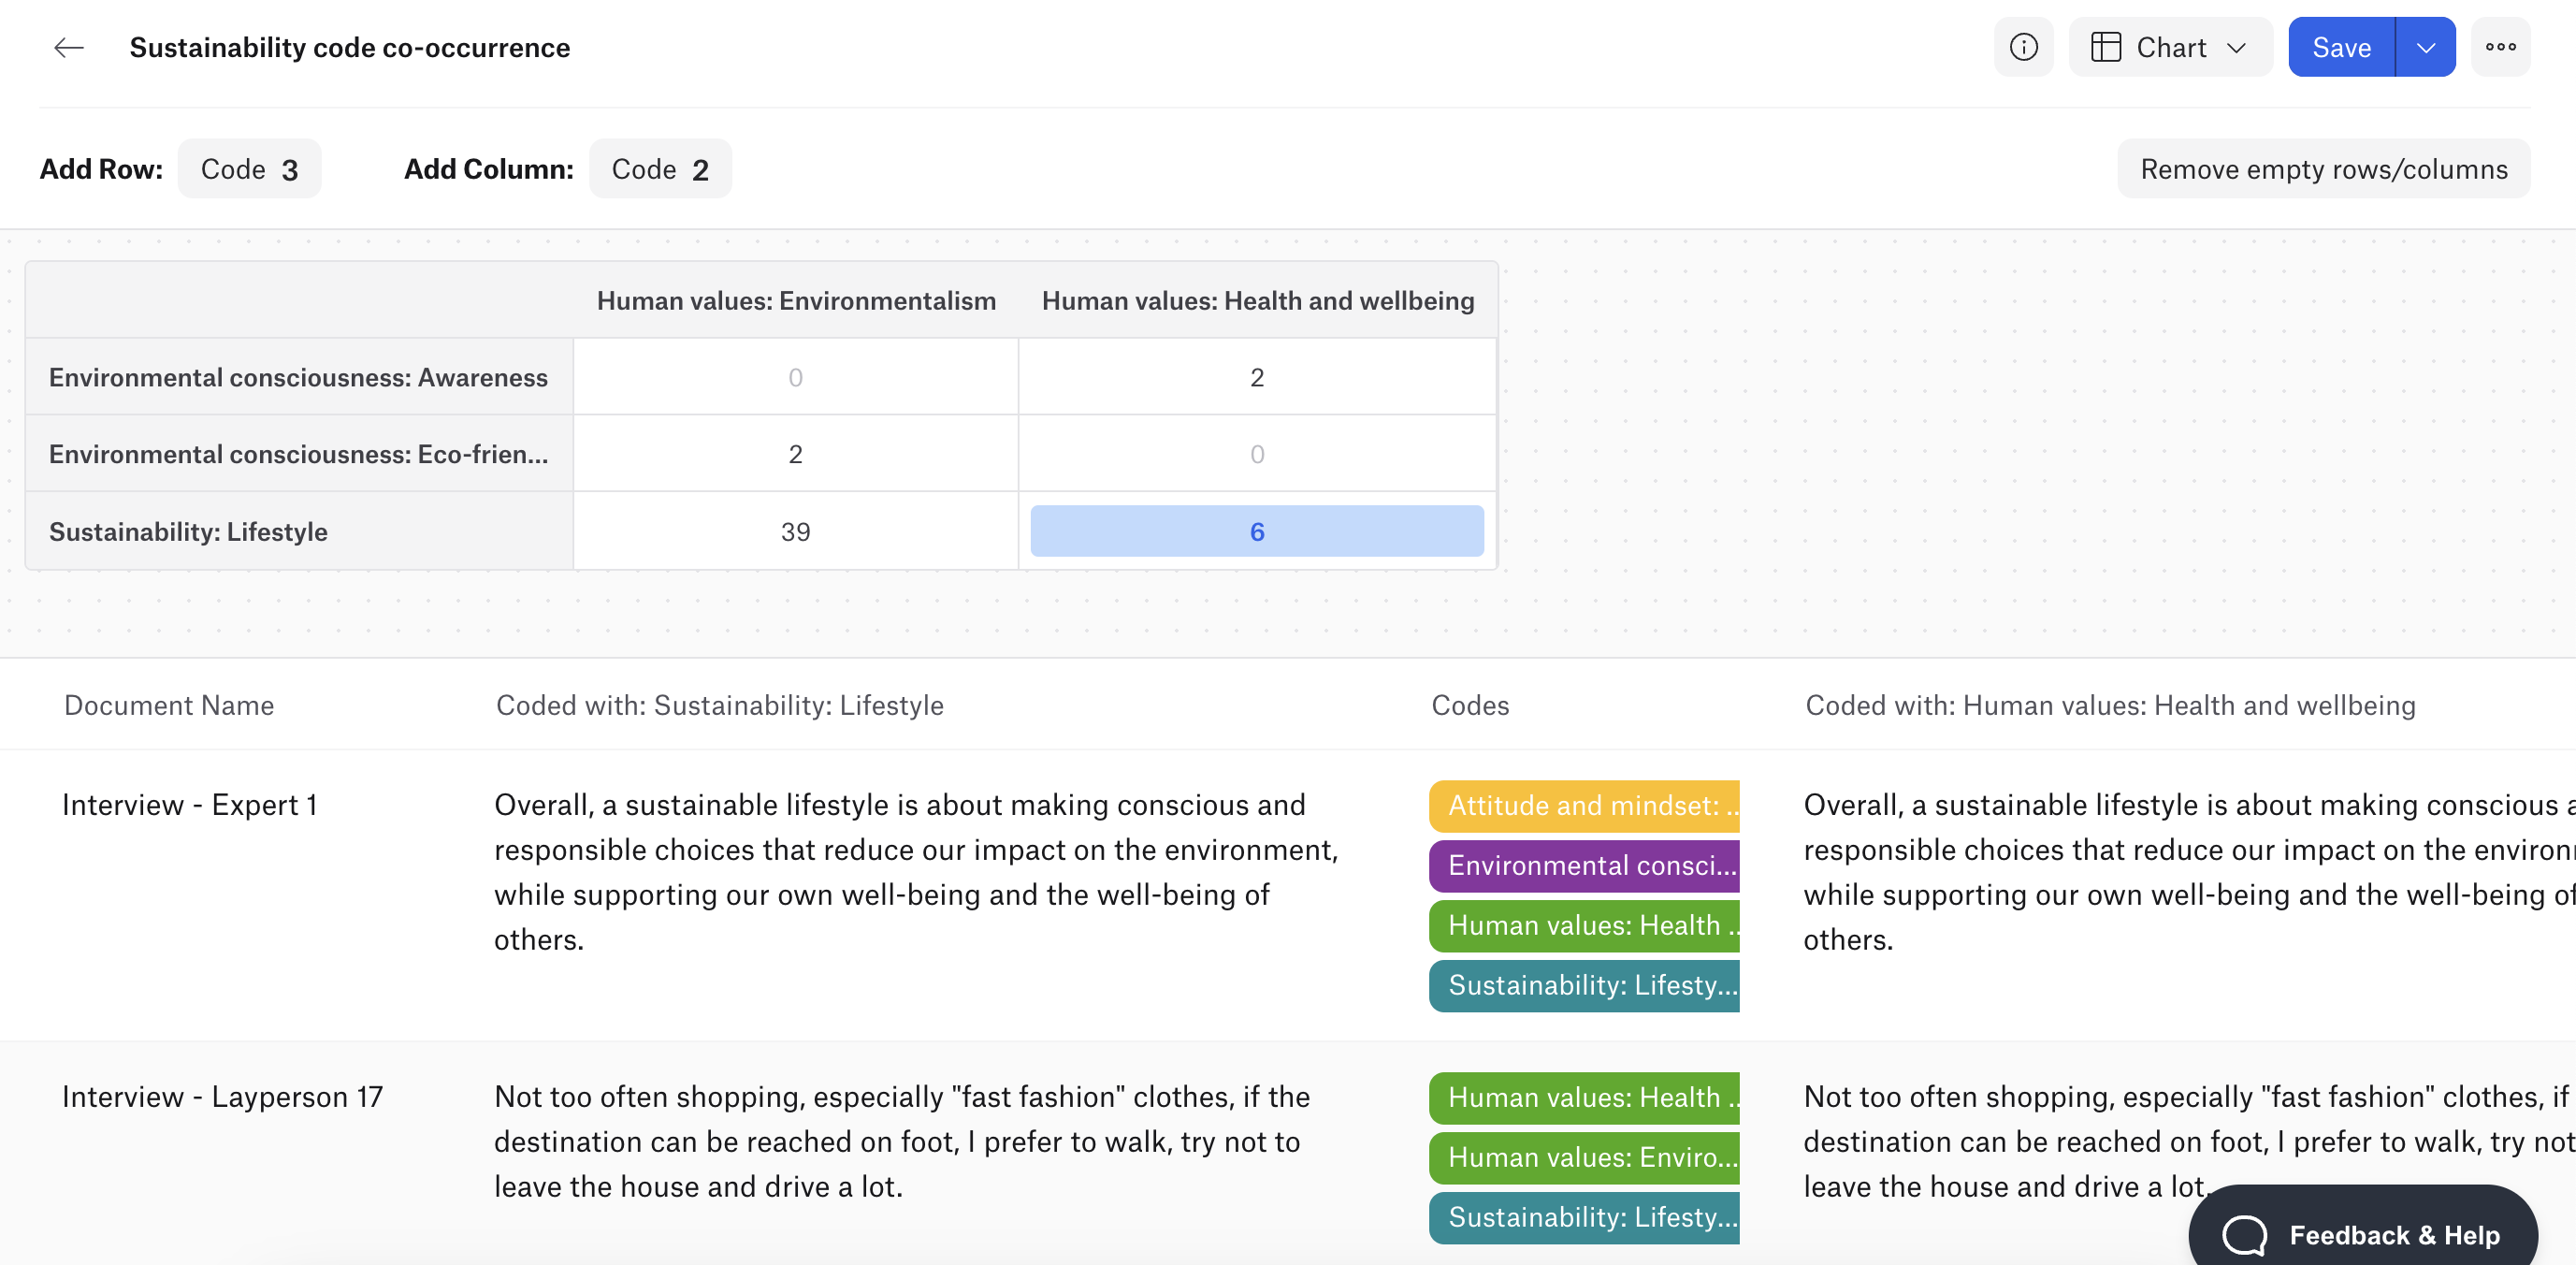
ATLAS.ti Web
-
Click the Views, the bar chart icon in the left toolbar.
-
Click + New View.
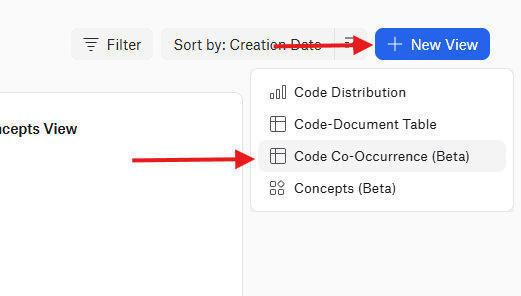
- Select Code Co-Occurrence.


You can rename the view by clicking the title in the upper-left corner.
Create a co-occurrence table
-
Select the codes you want to analyze for the rows and columns.
You can choose:
- individual codes
- categories
-
folders
- The table updates automatically after selecting codes.

The intersecting cells display the number of co-occurrences between each pair of codes.
For example:
- A value of “5” means the two codes co-occurred five times in the project.
- Lower frequencies may indicate weaker thematic overlap.
- Higher frequencies may suggest stronger conceptual connections.
You can click any cell to review the quotations where the co-occurrence occurs.
Interpret the results
The table helps you identify patterns and relationships across themes.
For example, in a sustainability project:
- “Sustainability” and “Human values” may co-occur frequently, suggesting that respondents often discuss sustainability in relation to ethics or responsibility.
- “Adaptability” and “Sustainability barriers” may co-occur less frequently, suggesting these topics are discussed together less often.
The interpretation always depends on the context of your data and research questions.
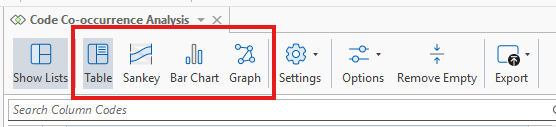
Visualize co-occurrences
ATLAS.ti offers multiple ways to visualize co-occurrence patterns:
- Table / matrix
- Sankey diagram
- Bar chart
- Force-directed graph
These visualizations can help you present relationships between themes in reports, papers, or presentations.
In ATLAS.ti Windows and Mac, visualizations can be exported as images. The table can also be exported to Excel.

In ATLAS.ti Web, Code Co-Occurrence results are saved as Views and update automatically as coding changes. Views cannot currently be exported.
Use the c-coefficient
The Code Co-occurrence Coefficient (c-coefficient) helps you understand how strongly two codes are connected in your data.
While the co-occurrence count tells you how many times two codes appear together, the c-coefficient helps you evaluate how meaningful that connection may be relative to how often each code was used overall.
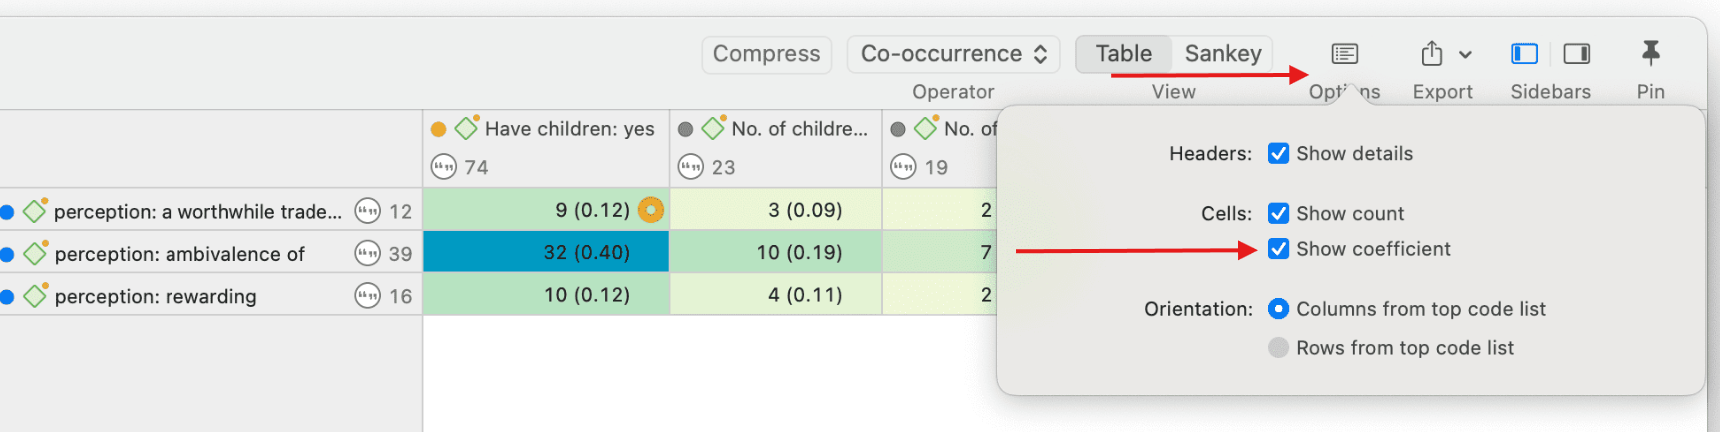
The coefficient ranges from 0 to 1:
- A value closer to 0 means the codes rarely appear together.
- A value closer to 1 means the codes almost always appear together when they are used.
For example:
- If two codes co-occur frequently and are both used at similar rates across the project, the c-coefficient will usually be higher.
- If one code appears hundreds of times while the other appears only a few times, the coefficient may stay low even if the smaller code often appears together with the larger one.
This is why it is important to interpret the coefficient together with the actual co-occurrence counts and your qualitative understanding of the data.
The c-coefficient can be especially useful in larger projects or survey datasets where you want to compare many code relationships systematically.
ATLAS.ti also provides visual indicators to help interpret the results:
- Yellow dots indicate large differences in code frequencies.
- Red dots indicate overlapping or redundant codings that may distort the coefficient.
- Orange dots indicate both conditions at the same time.
Additional options
Depending on the platform, you can also:
- remove empty rows and columns
- switch rows and columns
- use the AND operator for exact overlaps only
- cluster embedded quotations
- normalize the display
- sort results
- apply global filters using document groups
Common issues and mistakes
- Low coefficients may still be meaningful
- If one code appears much more frequently than another, the c-coefficient can look very small even when the relationship is analytically important.
- Co-occurrence does not automatically mean causation
- Two themes appearing together does not necessarily mean one influences the other. Always review quotations in context.
- Results depend on coding quality
- The usefulness of the analysis depends on how consistently and accurately the data was coded.
- Redundant coding can distort results
- Overlapping quotations coded repeatedly may produce inflated co-occurrence counts or coefficients above 1.
When to contact support
Contact support if:
- the code co-occurrence table does not update after coding changes
- exported results are missing values
- visualizations fail to load
- the tool behaves unexpectedly after importing or merging projects