
What is the Code-Document Table Tool?
Key takeaways
- The Code-Document Table helps you analyze where codes appear across documents.
- You can compare individual codes, code groups, documents, and document groups.
- ATLAS.ti Windows, Mac, and Web support table visualizations and interactive exploration of quotations.
- Sankey visualizations are available across all platforms.
- Results can be exported to Excel for reporting and further analysis.
Who this article is for
This article is for ATLAS.ti Windows, Mac, and Web users who want to compare coding frequencies and identify patterns across documents.
What is the Code-Document Table?
The Code-Document Table is an analysis tool that displays coding frequencies across documents. It helps you explore where themes appear in your project and compare patterns between participants, datasets, or groups.
You can analyze:
- codes and code groups
- documents and document groups
Each table cell shows how often a code appears in a document. Clicking a cell opens the related quotations so you can inspect the underlying data directly.

For exploring the ways to use Code-Document Analysis in ATLAS.ti Desktop, we highly recommend this article:
Open the Code-Document Table
In ATLAS.ti Desktop:
- Windows: Analyze > Code Document Analysis
- Mac: Analysis > Code-Document Analysis

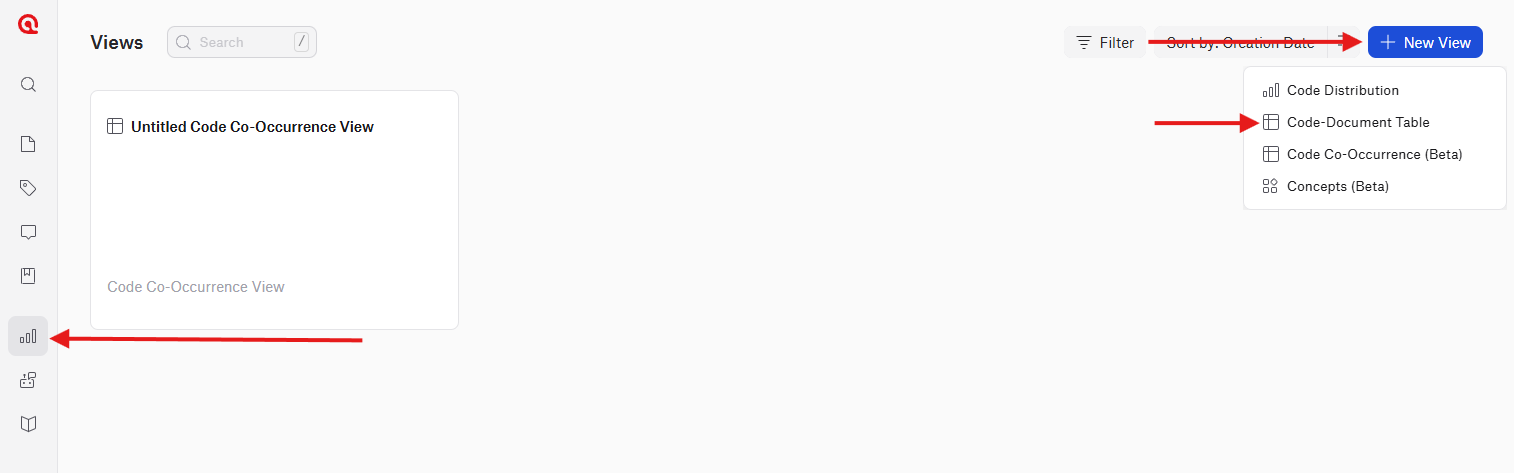
In ATLAS.ti Web:
- Click Views
- Select New View
-
Choose Code Document Table
- Select your codes/code groups and documents/document groups
- Name and save the view

Build your analysis
On all platforms, select the codes or code groups for one dimension of the table and the documents or document groups for the other.
The table updates automatically as you make selections.
You can:
- click cells to review quotations
- click row headers to inspect all quotations for a code
- click column headers to inspect all quotations for a document
This allows you to move quickly between overall patterns and detailed qualitative evidence.
Use frequency and comparison options
The table supports several analysis modes.
Absolute frequencies show the number of codings.
Relative frequencies display percentages based on:
- rows
- columns
- the entire table

Normalization adjusts counts when documents differ greatly in size, making comparisons more reliable.
Desktop versions also allow you to:
- count coded words instead of codings
- binarize results into occurrence/non-occurrence values
- compress empty rows and columns (Remove empty)

Visualize the results
Available visualizations differ slightly by platform.
ATLAS.ti Web:
- Table
- Sankey chart (beta)

ATLAS.ti Mac:
- Table
- Sankey diagram
- Column chart

ATLAS.ti Windows:
- Table
- Sankey diagram
- Bar chart

Sankey diagrams visualize relationships between codes and documents, making overlaps and dominant themes easier to identify.
Export results
Desktop versions can also export the created Table in Excel and visualizations as image files.

Review quotations and continue coding
On all platforms, you can click any table cell to inspect the quotations behind that specific code-document intersection. For example, clicking a cell lets you review all quotations where a particular code appears in a particular document.
You can also click:
- a code row to view all quotations connected to that code
- a document column to view all quotations connected to that document
The related quotations appear alongside the table, to the right, where you can continue working with the data directly.

In ATLAS.ti Windows and Mac, you can:
- double-click quotations to open them in context
- apply additional codes directly from the quotation list
- export selected quotations to Excel
- use the View (eye) button to change the quotation preview size between single-line, small, or large previews

This makes it easy to move between frequency analysis and detailed qualitative interpretation without leaving the tool.
Common issues
- Frequencies seem too high
- Code groups may contain several codes applied to the same quotation, increasing the total number of codings.
- Documents are difficult to compare
- Use Normalize when documents differ significantly in length.
- The table contains many empty rows or columns
- On desktop, use Compress to remove rows or columns without results.
When to contact support
Contact support if:
- the table does not load correctly
- visualizations are missing
- exports fail
- frequencies appear incorrect after merging or importing projects