
How does analysis of inter-coder agreement work?
How does analysis of inter-coder agreement work?
I am working in a team. It would be fantastic if we could analyze the inter-coder agreement of our work. Is this possible with ATLAS.ti?
In ATLAS.ti 8 and newer, you can test inter-coder agreement in text, audio and video documents. Image documents are not supported.
ATLAS.ti’s inter-coder agreement tool lets you assess the agreement of how multiple coders code a given body of data. In developing the tool we worked closely together with Prof. Klaus Krippendorff , one of the leading experts in this field, author of the book Content Analysis: An Introduction of Its Methodology, and the originator of the Krippendorff’s alpha coefficient.
In addition to Krippendorff’s alpha, you can use percent agreement or the Holsti index to measure inter-coder agreement.
Learn more about how to implement ICA in the full software manual.
Percent Agreement
Percentage Agreement is the simplest measure of inter-coder agreement. It is calculated as the number of times a set of ratings are the same, divided by the total number of units of observation that are rated, multiplied by 100.
The benefits of percentage agreement are that it is simple to calculate, and it can be used with any type of measurement scale.
This is how you calculate it:
Percent Agreement (PA) = number of agreements / total number of segments
Holsti Index
The Holsti index is a variation of the percent agreement measure for situations where coders do not code precisely the same data segment. This is the case if coders set their own. Like Percent Agreement, also the Holsti index does not take into account chance agreement.
The formula for the Holsti Index is:
PA (Holsti) = 2A/ (N1+N2)
PA (Holsti) represents percentage of agreement between two coders; A is the number of the two coders’ consensus decisions, and N1 and N2 are numbers of decisions the coders have made respectively .
The results for Percentage agreement and the Holsti Index are the same when all coders code the same data segments.
Krippendorff’s Family of Alpha Coefficients
The family of alpha coefficients offers various measurement that allow you to carry out calculations at different levels. They can be used for more than two coders, are sensitive to different sample sizes and can be used with small samples as well.
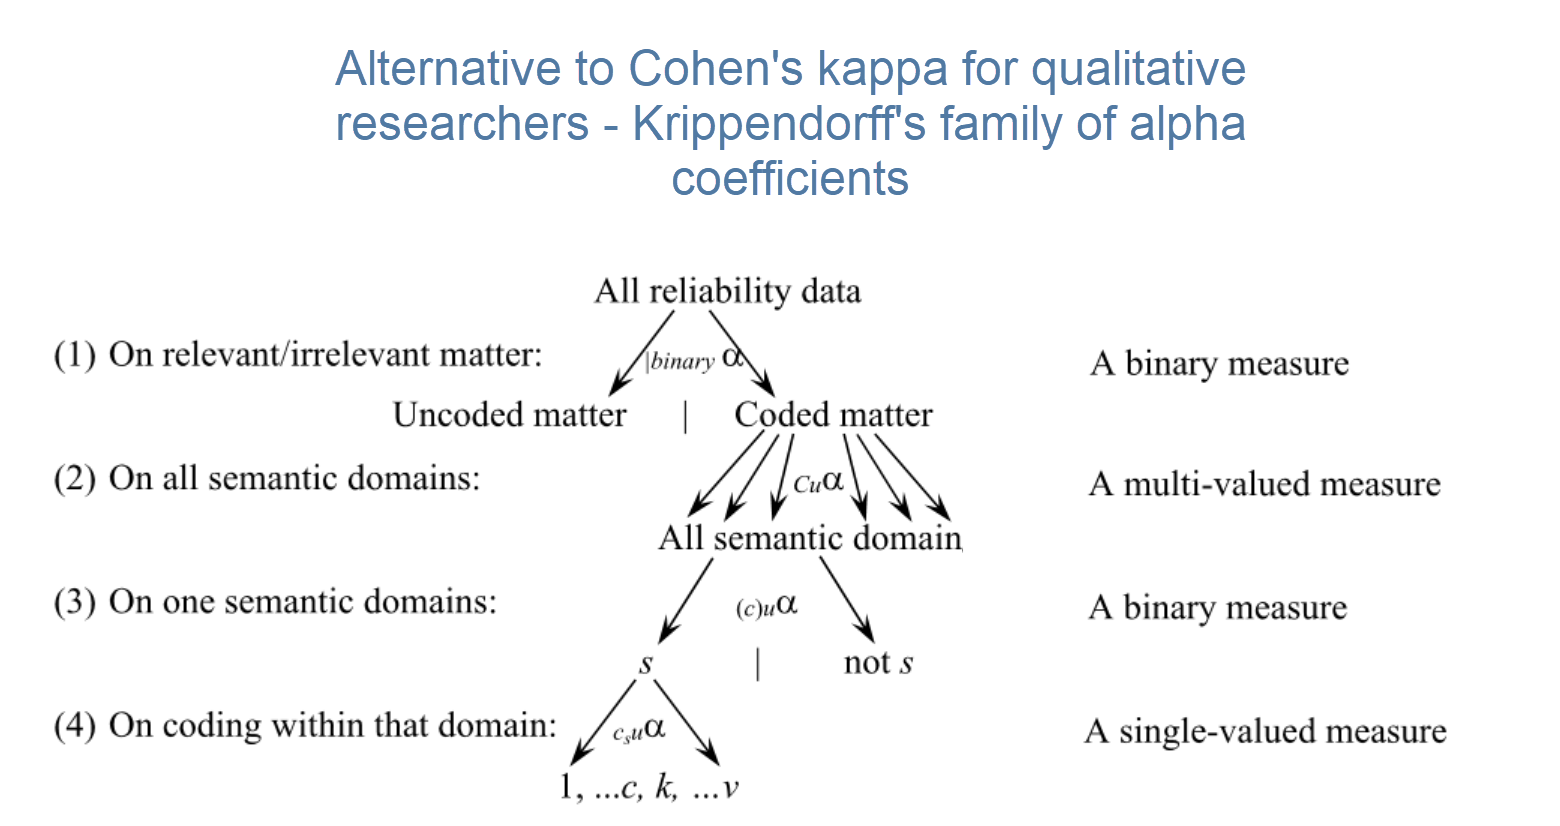
Krippendorff’s family of alpha coefficients – from the general to the specific
Alpha binary
At the most general level, you can measure whether different coders identify the same sections in the data to be relevant for the topics of interest represented by codes. All text units are taken into account for this analysis, coded *as well* as not coded data.
You can, but do not need to use semantic domains at this level. It is also possible to enter a single code per domain. You get a value for alpha binary for each code (or each semantic domain) in the analysis, and a global value for all codes (or all domains) in the analysis.
The global alpha binary value might be something you want to publish in a paper as an overall value for inter-coder agreement for your project.
The values for each code or semantic domain provide feedback which of the codes / domains are satisfactory in terms of inter-coder agreement, and which are understood in different ways by the different coders. These are codes / domains you need to improve and test gain, albeit with different coders.
Tip: If you work with pre-defined quotations, the binary coefficient will be 1 for a semantic domain if only codes of the same semantic domain have been applied, regardless which code within the domain has been applied.
The value for global alpha binary will always be 1 when working with pre-defined quotations as all coded segments are the same.
cu-alpha
Another option is to test whether different coders were able to distinguish between the codes of a semantic domain. For example, if you have a semantic domain called EMOTIONS with the sub codes:

The coefficient gives you an indication whether the coders were able to reliably distinguish between for instance ‘joy’ and ‘excitement’, or between ‘fear’ and ‘anger’. The cu-alpha will give you a value for the overall performance of the semantic domain. It will however not tell you which of the sub codes might be problematic. You need to look at the quotations and check where the confusion is. Cu-alpha
Cu-alpha is the global coefficient for all cu-alphas. It takes into account that you can apply codes from multiple semantic domains to the same or overlapping quotations. Thus, Cu-alpha is not just the average of all cu-alphas.
If codes of a semantic domain ‘A’ have been applied to data segments that are coded with codes of a semantic domain ‘B’, this does not affect the cu-alpha coefficient for either domain A or B, but it effects the overall Cu-alpha coefficient.
You can interpret the Cu-alpha coefficient as indicating the extent to which coders agree on the presence or absence of the semantic domains in the analysis. Formulated as a question: Could coders reliably identify that data segments belong to a specific semantic domain, or did the various coders apply codes from other semantic domains?
In the calculation for both the cu- and Cu-alpha coefficient, only coded data segments are included in the analysis.
csu-alpha
This coefficient also belongs to the family of alpha coefficients, but it is not yet implemented. Once implemented, it will allow you to drill down a level deeper, and you can check for each semantic domain which code within the domain performs well or not so well. It indicates the agreement on coding within a semantic domain.
Cohen’s Kappa
We acknowledge that Cohen’s Kappa is a popular measure, but we opted for not implementing it because it can only be used for 2 coders, it assumes an infinite sample size, which is never the case in qualitative resarch, and because of the well-known limitations identified in the literature:
“It is quite puzzling why Cohen’s kappa has been so popular in spite of so much controversy with it. Researchers started to raise issues with Cohen’s kappa more than three decades ago (Kraemer, 1979; Brennan & Prediger, 1981; Maclure & Willett, 1987; Zwick, 1988; Feinstein & Cicchetti, 1990; Cicchetti & Feinstein, 1990; Byrt, Bishop & Carlin, 1993). In a series of two papers, Feinstein & Cicchetti (1990) and Cicchetti & Feinstein (1990) made the following two paradoxes with Cohen’s kappa well-known: (1) A low kappa can occur at a high agreement; and (2) Unbalanced marginal distributions produce higher values of kappa than more balanced marginal distributions. While the two paradoxes are not mentioned in older textbooks (e.g. Agresti, 2002), they are fully introduced as the limitations of kappa in a recent graduate textbook (Oleckno, 2008). On top of the two well-known paradoxes aforementioned, Zhao (2011) describes twelve additional paradoxes with kappa and suggests that Cohen’s kappa is not a general measure for interrater reliability at all but a measure of reliability under special conditions that are rarely held.
Krippendorff (2004) suggests that Cohen’s Kappa is not qualified as a reliability measure in reliability analysis since its definition of chance agreement is derived from association measures because of its assumption of raters’ independence. He argues that in reliability analysis raters should be interchangeable rather than independent and that the definition of chance agreement should be derived from estimated proportions as approximations of the true proportions in the population of reliability data. Krippendorff (2004) mathematically demonstrates that kappa’s expected disagreement is not a function of estimated proportions from sample data but a function of two raters’ individual preferences for the two categories.” (Xie, 2013).
Please see the full manual for ATLAS.ti Windows or ATLAS.ti Mac to find more details about calculating ICA and setting up your ATLAS.ti project for teamwork.