
How to create networks in ATLAS.ti
Key takeaways
- Networks help visualize relationships between codes, quotations, memos, documents, and other project entities.
- Networks can be created in ATLAS.ti Windows and Mac (but not ATLAS.ti Web).
- You can create conceptual maps by adding nodes and linking them with named relationships.
- Networks support both manual arrangement and automatic layouts.
- Networks can be exported as images or PDFs for presentations, reports, or publications.
Who this article is for
This article is for ATLAS.ti Windows and Mac users who want to visualize connections in their qualitative analysis using networks.
What are networks in ATLAS.ti?
Networks are visual diagrams that help you explore and present relationships in your data.
You can add and connect:
- Codes
- Quotations
- Memos
- Documents
- Groups
- Other networks
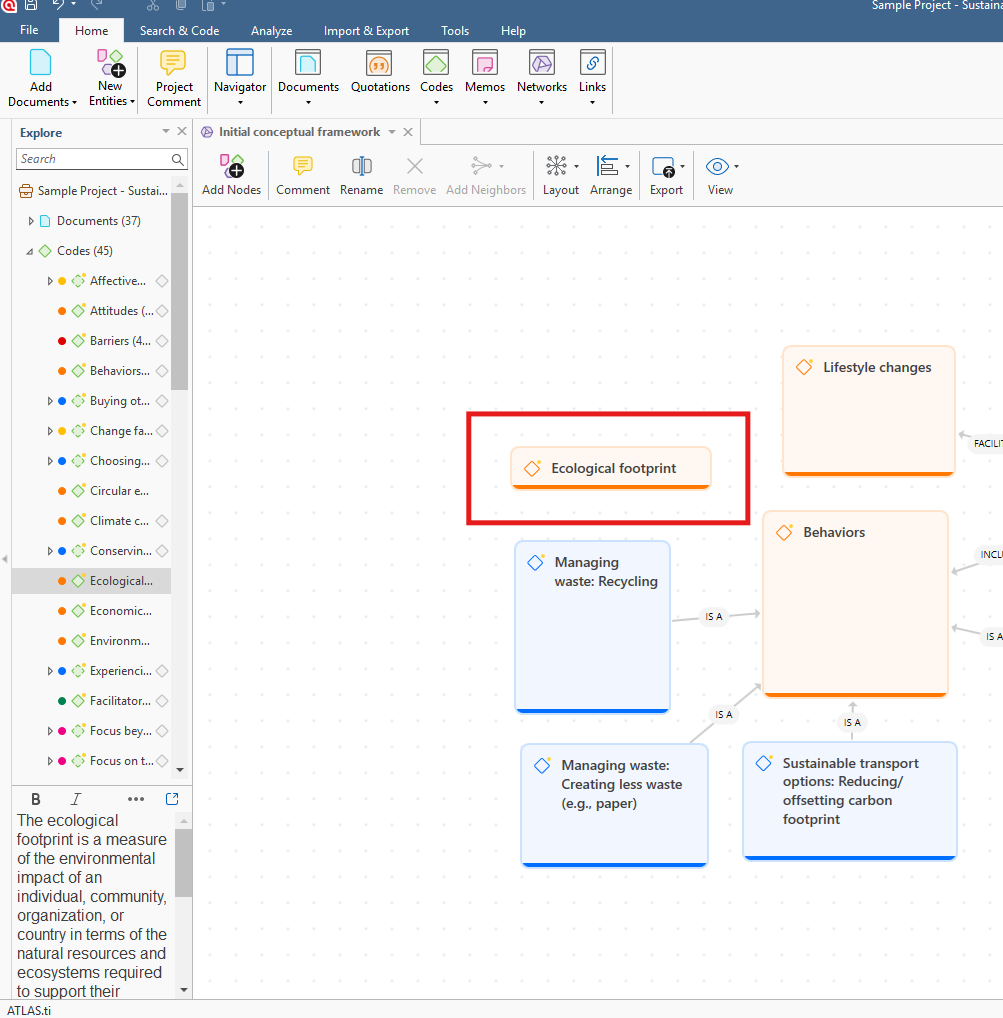
Here is an example of a full network view from our Sample Project in ATLAS.ti for Windows:
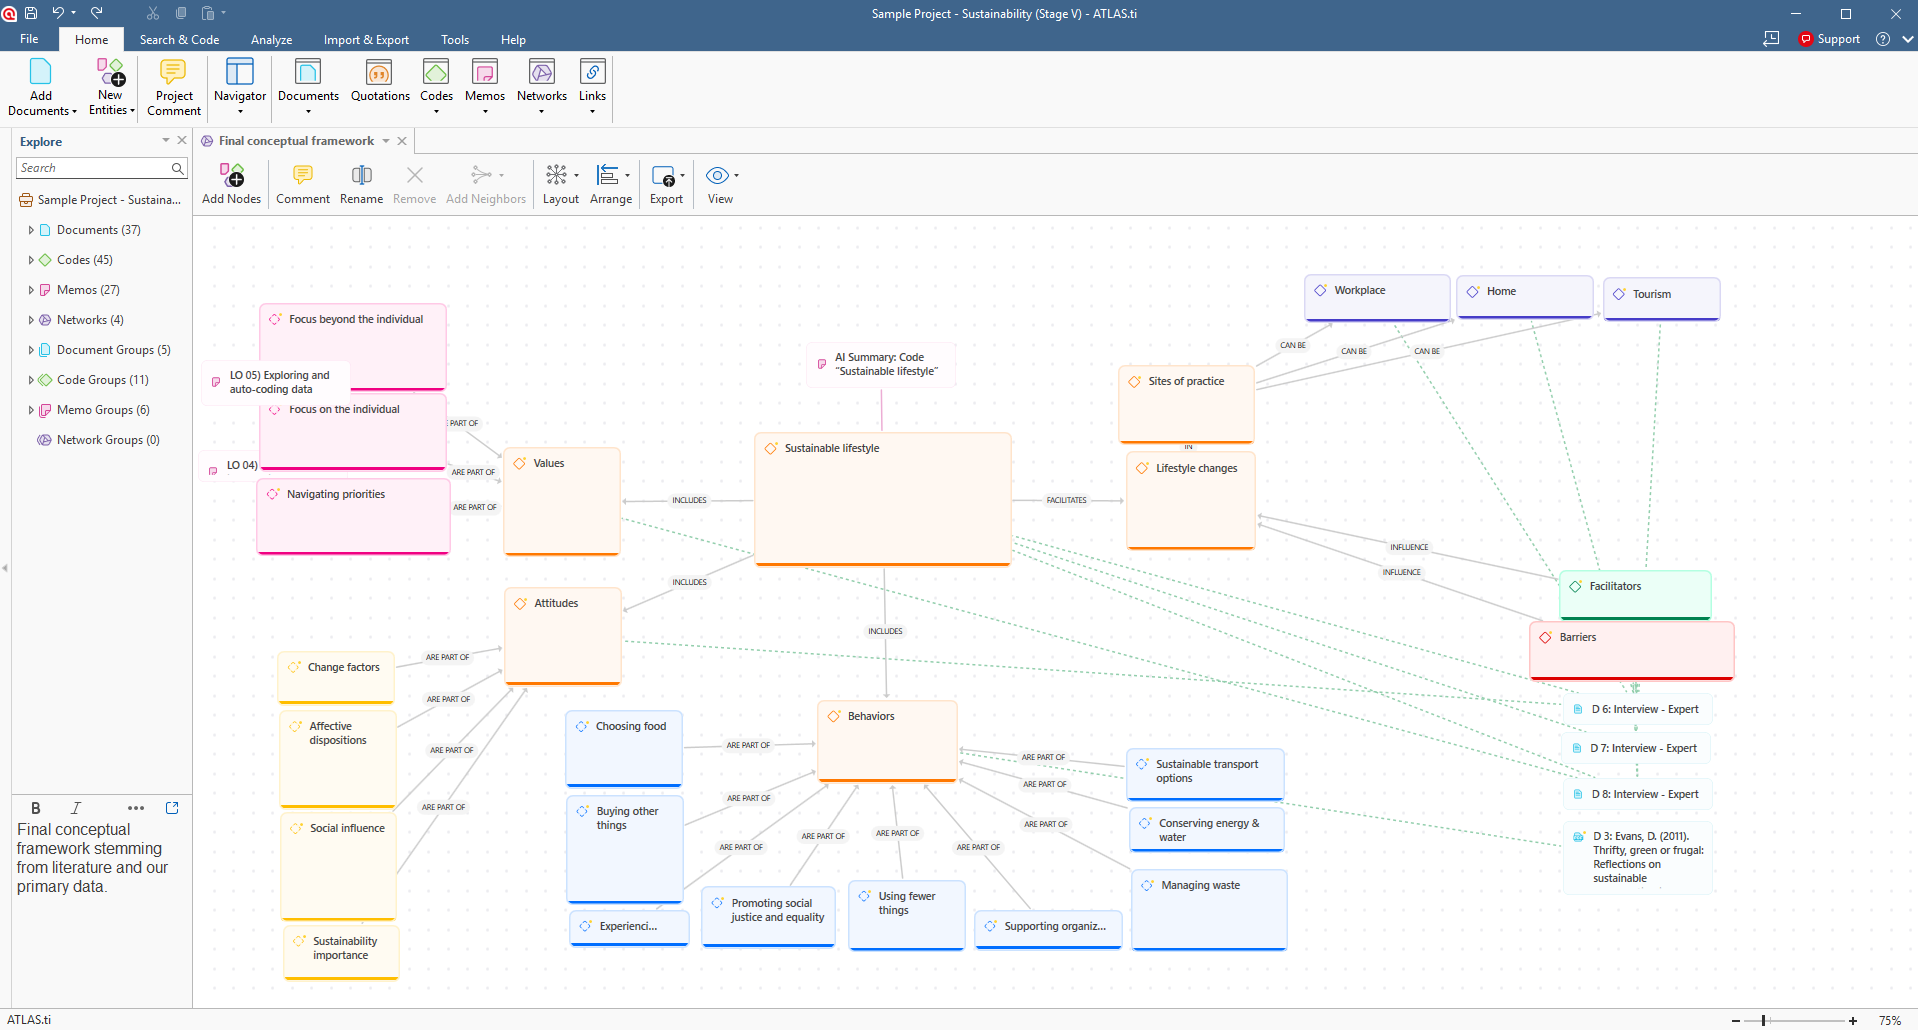
Each item in a network is called a node. Nodes can be connected with links and labeled relationships to show how concepts relate to each other.
Networks are especially useful for:
- Exploring themes and patterns
- Building conceptual models
- Comparing cases
- Mapping theories and processes
- Presenting findings visually
Visualization can help reduce the complexity of large qualitative projects by showing connections spatially rather than only through text.
Create a network
ATLAS.ti Windows
- Open the Network Manager.
-
Click Create Network.
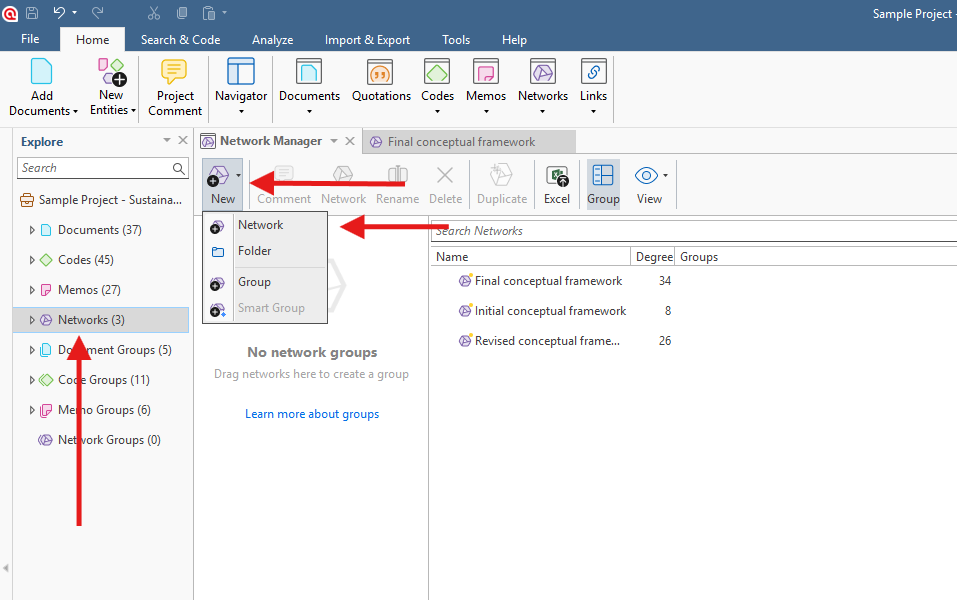
- Enter a name for the network.
- Open the network to begin editing.

ATLAS.ti Mac
- Open the Network Manager.
-
Click on New > New Network.
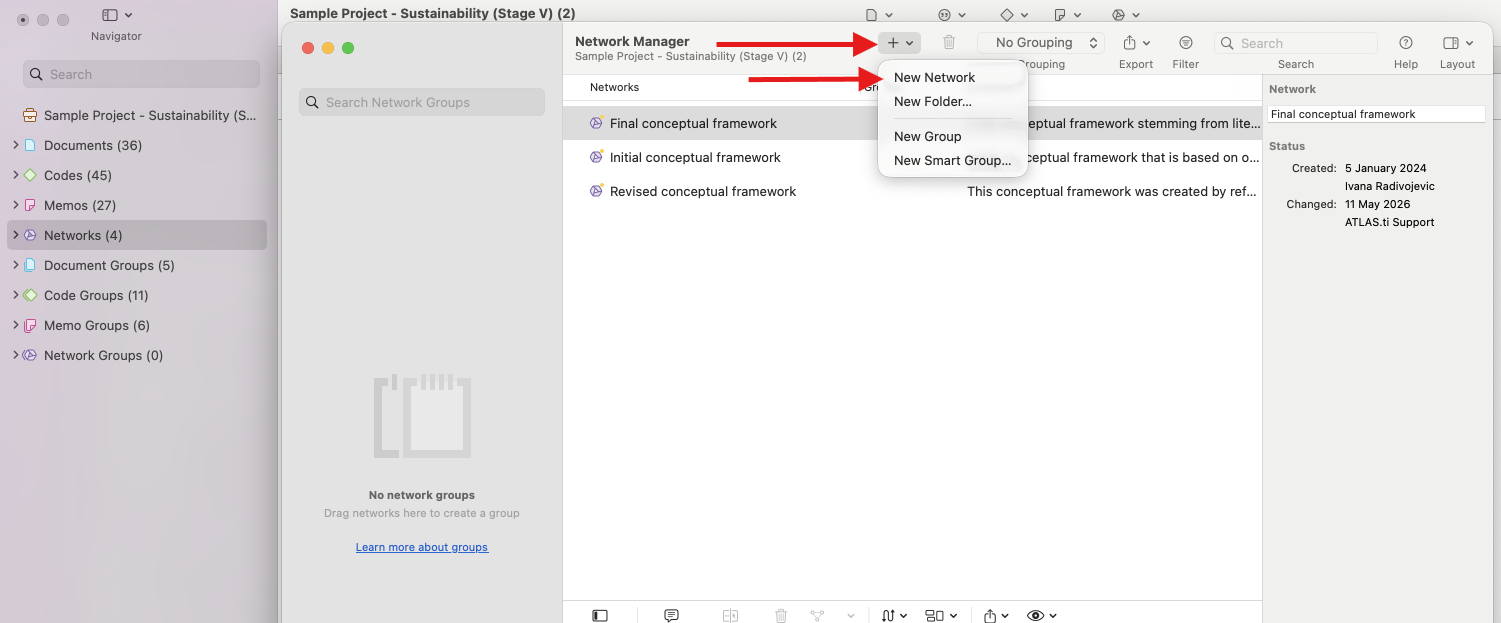
- Enter a network name.
- Open the network editor.

The Network Manager stores all saved networks in your project and allows you to rename, group, duplicate, comment on, or delete them.
You can also simply right-click on the Networks from the left panel and select "New Network" to quickly create a new network for your project.
Add nodes to a network
The network editor is a visual workspace where you can drag and arrange entities.
You can add:
- Codes
- Quotations
- Memos
- Documents
- Groups
- Other networks
Windows and Mac
- Drag and drop entities directly into the network editor
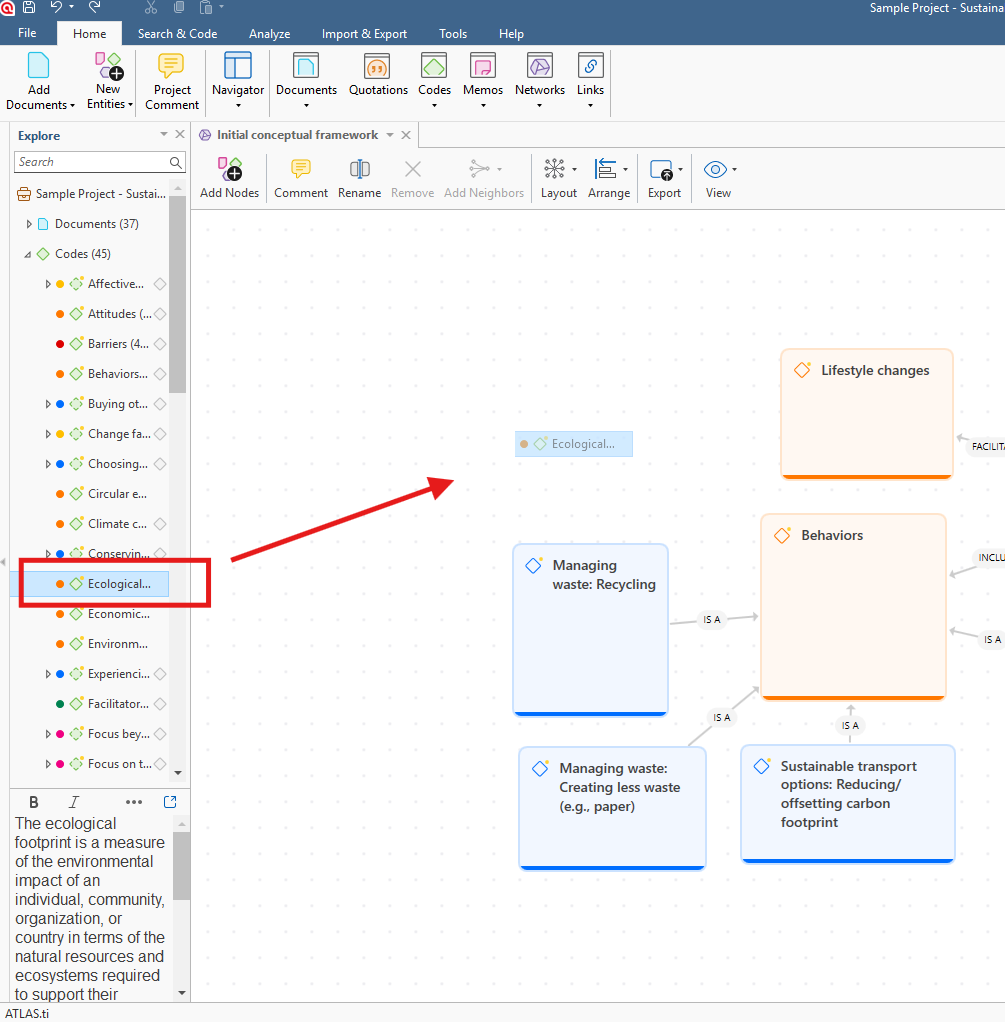
- You can move nodes freely around the workspace to organize your visualization.
- A single code, memo, or quotation can appear in multiple networks.
Link nodes with relationships
Links connect two nodes inside a network. A relationship is the label or meaning attached to that link.
For example, you might connect two codes with relationships such as:
- “influences”
- “leads to”
- “contradicts”
- “is associated with”
Relationships help explain how concepts, quotations, or themes connect within your analysis.
Windows and Mac
- Click on a node.
- Click and hold the small white square in the top-left corner, then drag it onto another node and release the mouse button.
- Select a relationship type.
These links help build conceptual models and analytical frameworks.
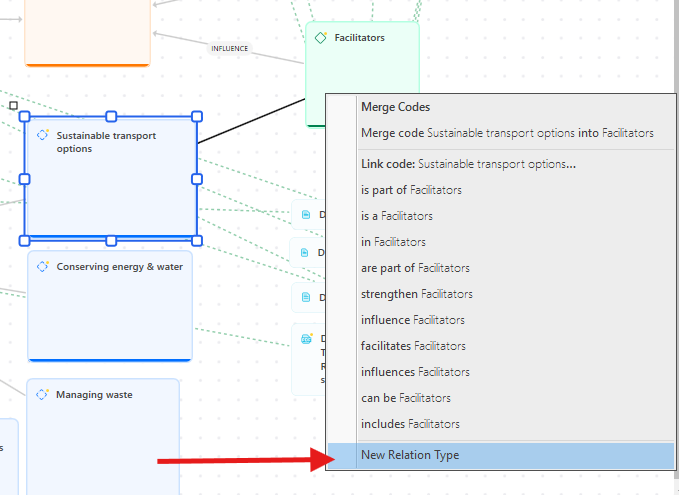
You can create new custom relationship types directly in the network when connecting one node to another:
Relationships can be created between:
- Codes and codes (links)
- Quotations and quotations (hyperlinks)
Use the Link Manager
The Link Manager gives you an overview of all links in the project, including:
- Code-code links
- Hyperlinks between quotations
You can use it to:
- Review links
- Change relationships
- Flip link direction
- Add comments
- Filter links by relation type
- Open connected networks
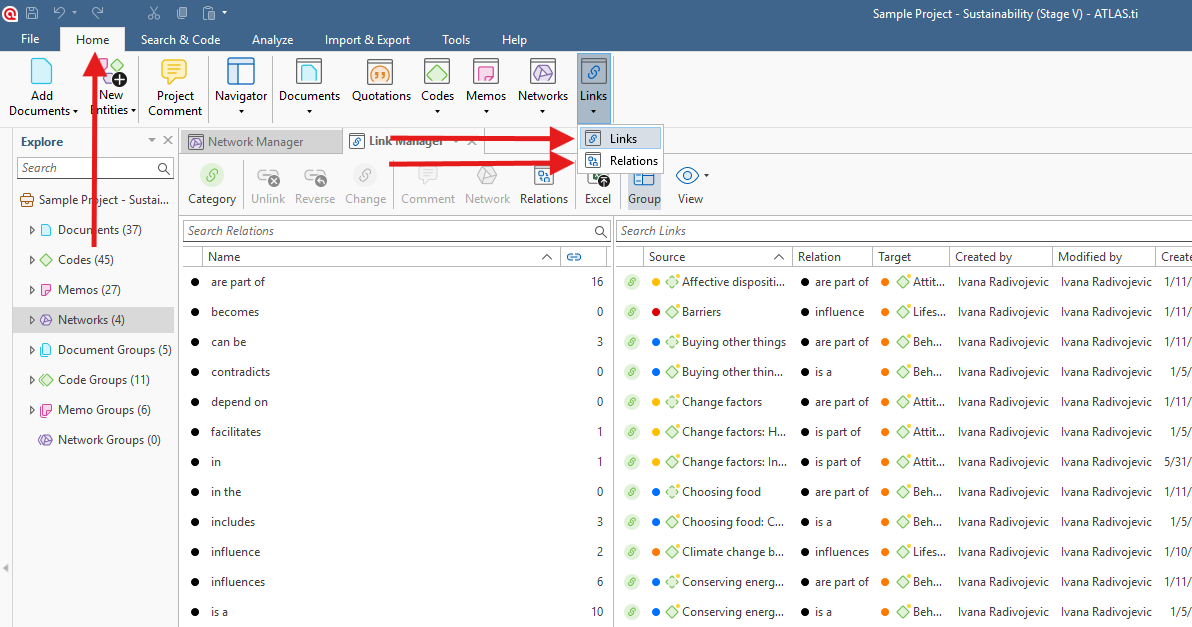
Open the Link and Relations Manager
Windows
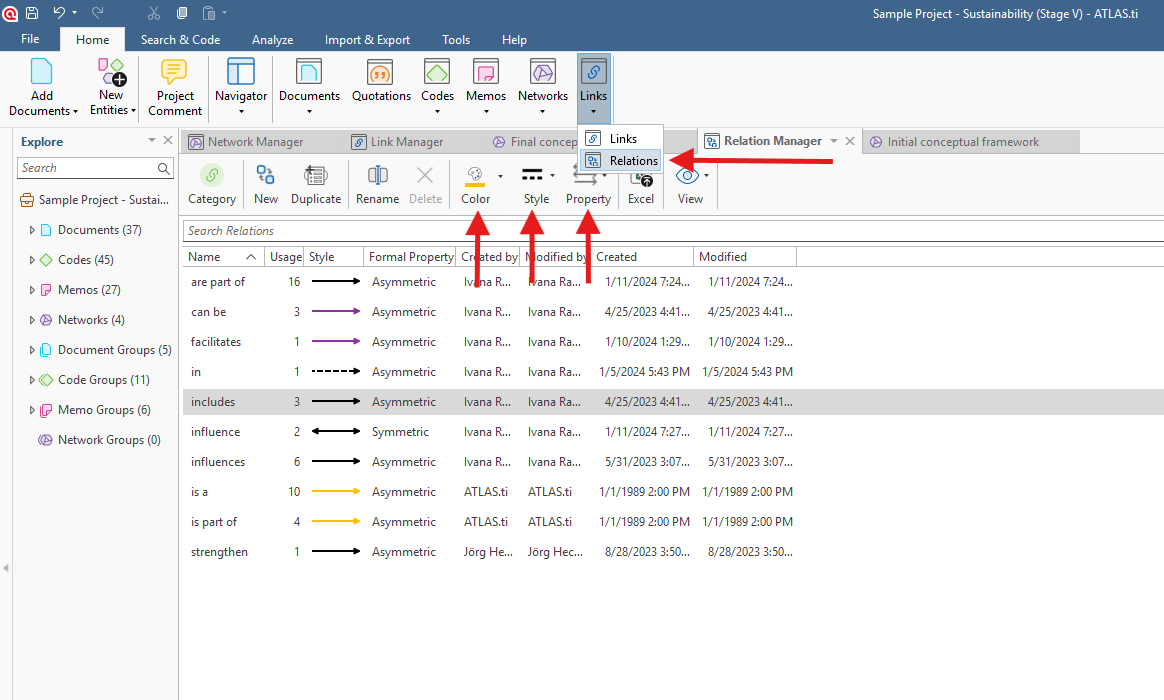
Click on Home > Links or Relations.
Mac
You can open:
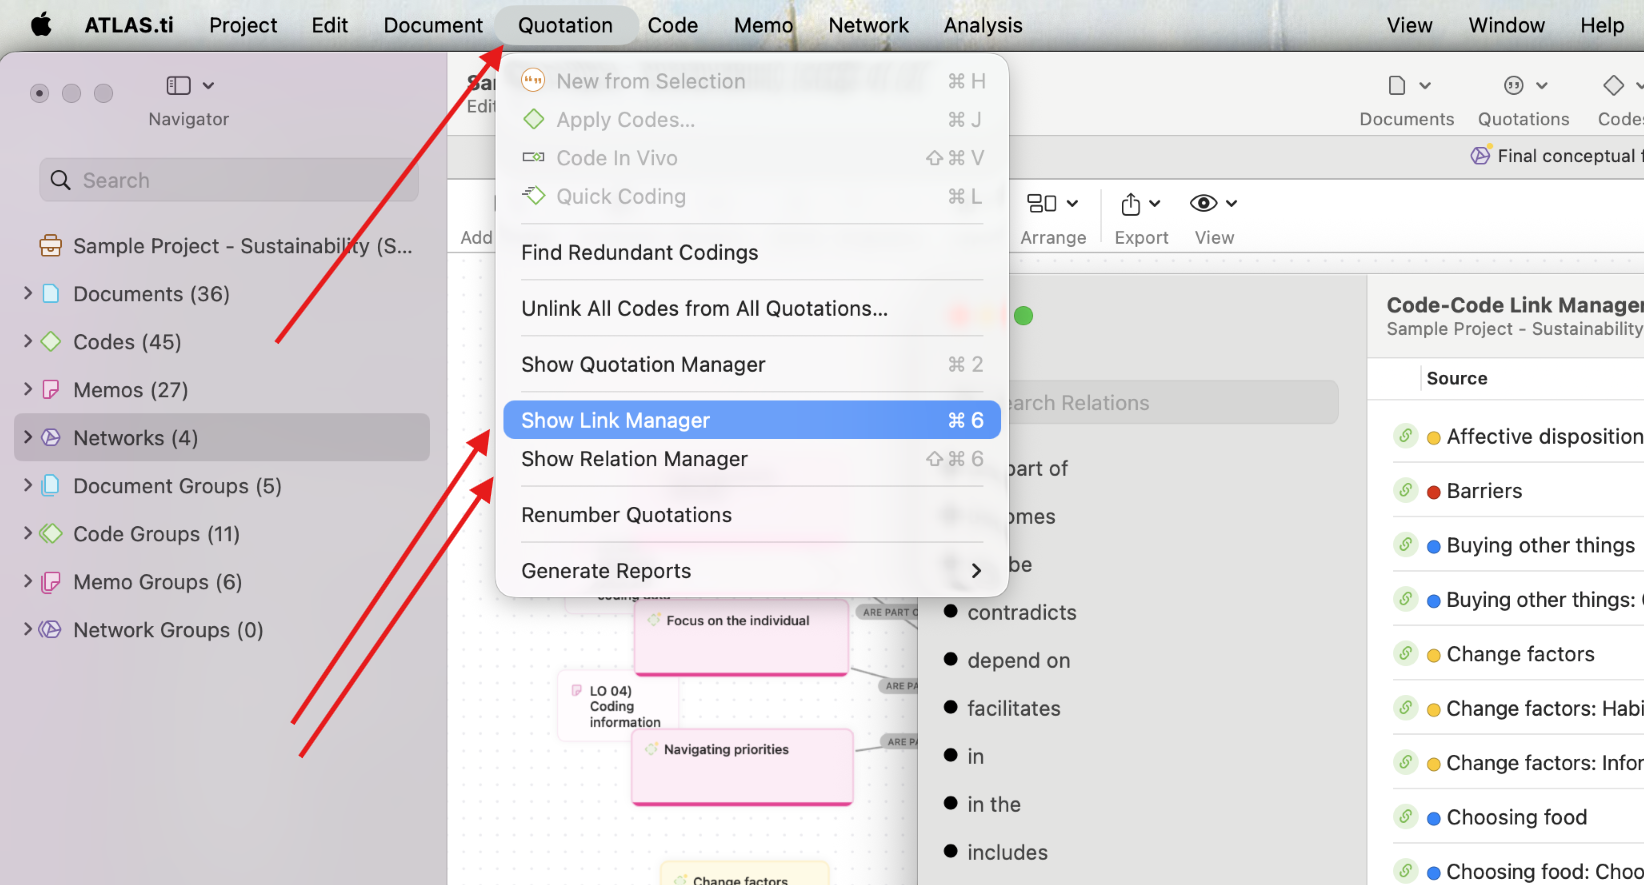
- The Link/Relations Manager for quotations (hyperlinks) from the Quotation menu:
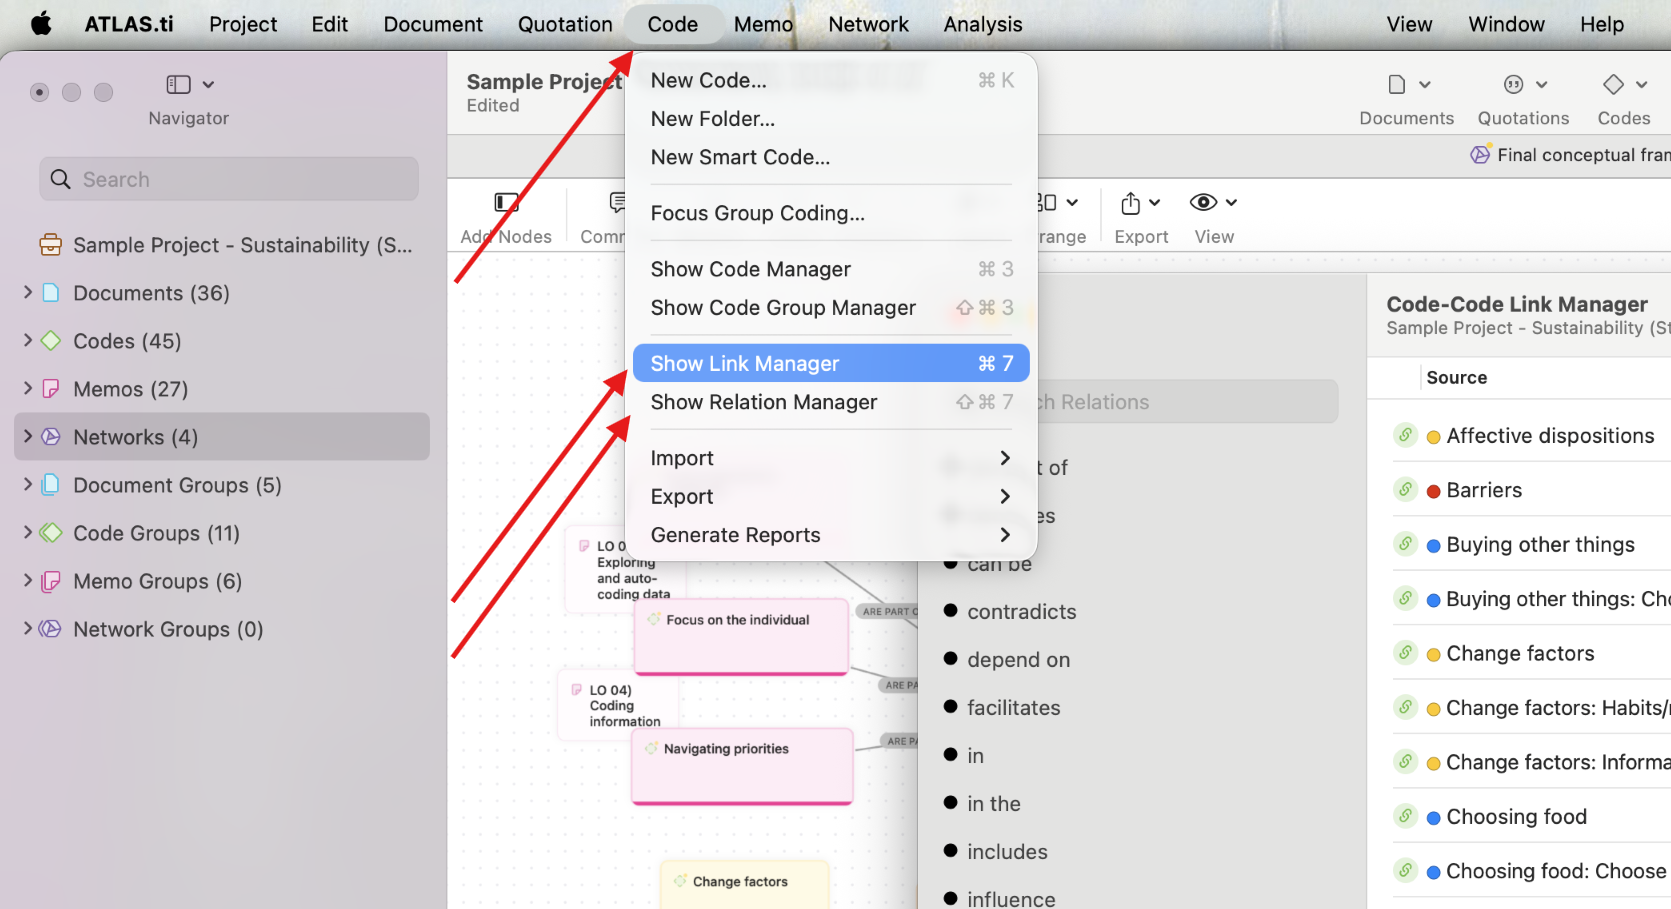
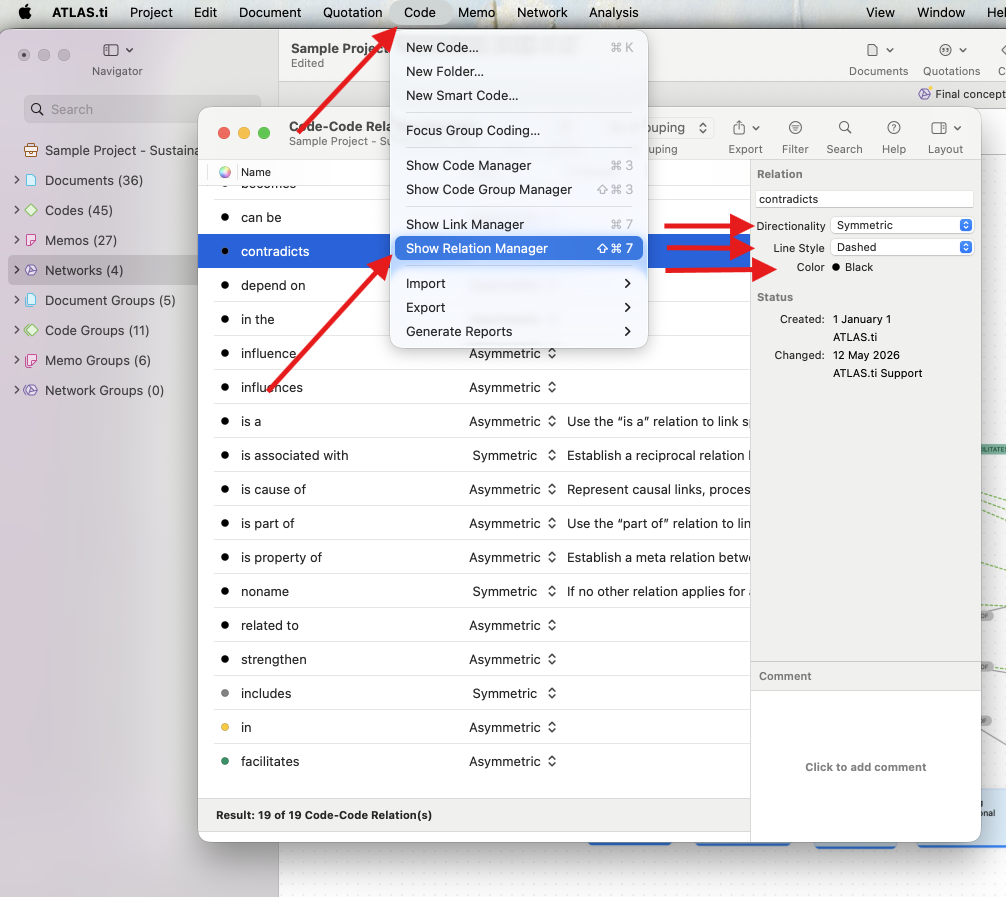
- The Link/Relations Manager for codes from the Code menu:
The Link Manager also shows information such as:
- Source node
- Target node
- Relationship type
- Creator and modification history
- Creation and modification dates
Create and modify relationships
Examples include:
- supports
- causes
- overlaps with
- contradicts
You can also customize:
- Line color
- Line style
- Symmetric or asymmetric behavior
Windows:
Mac:
Custom relationships are saved within the project and can be reused throughout your analysis.
Add neighbors to expand your network
The Add Neighbors option helps quickly expand a network by automatically adding connected entities to any selected node.
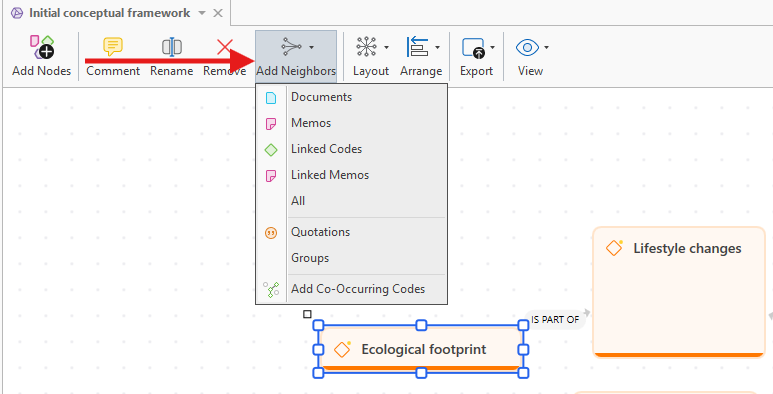
Examples include:
- Quotations connected to a code
- Memos related to a concept
- Documents linked to coded segments
This is useful when exploring larger patterns in your project without manually adding every node.
Arrange and organize networks
Networks can be arranged manually or automatically.
Layout options
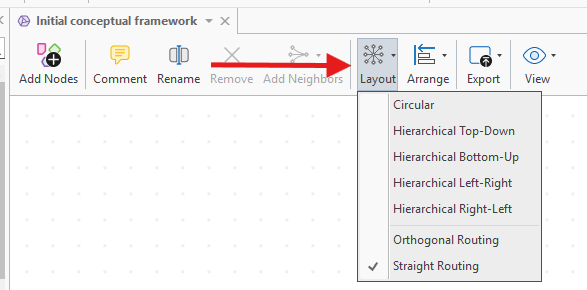
Windows and Mac include several automatic layouts, including:
- Circular
- Hierarchical
- Top-down
- Bottom-up
- Left-right
- Right-left
These layouts reorganize nodes to make connections easier to interpret.
You can always undo layout changes with:
Ctrl + Zon WindowsCmd + Zon Mac
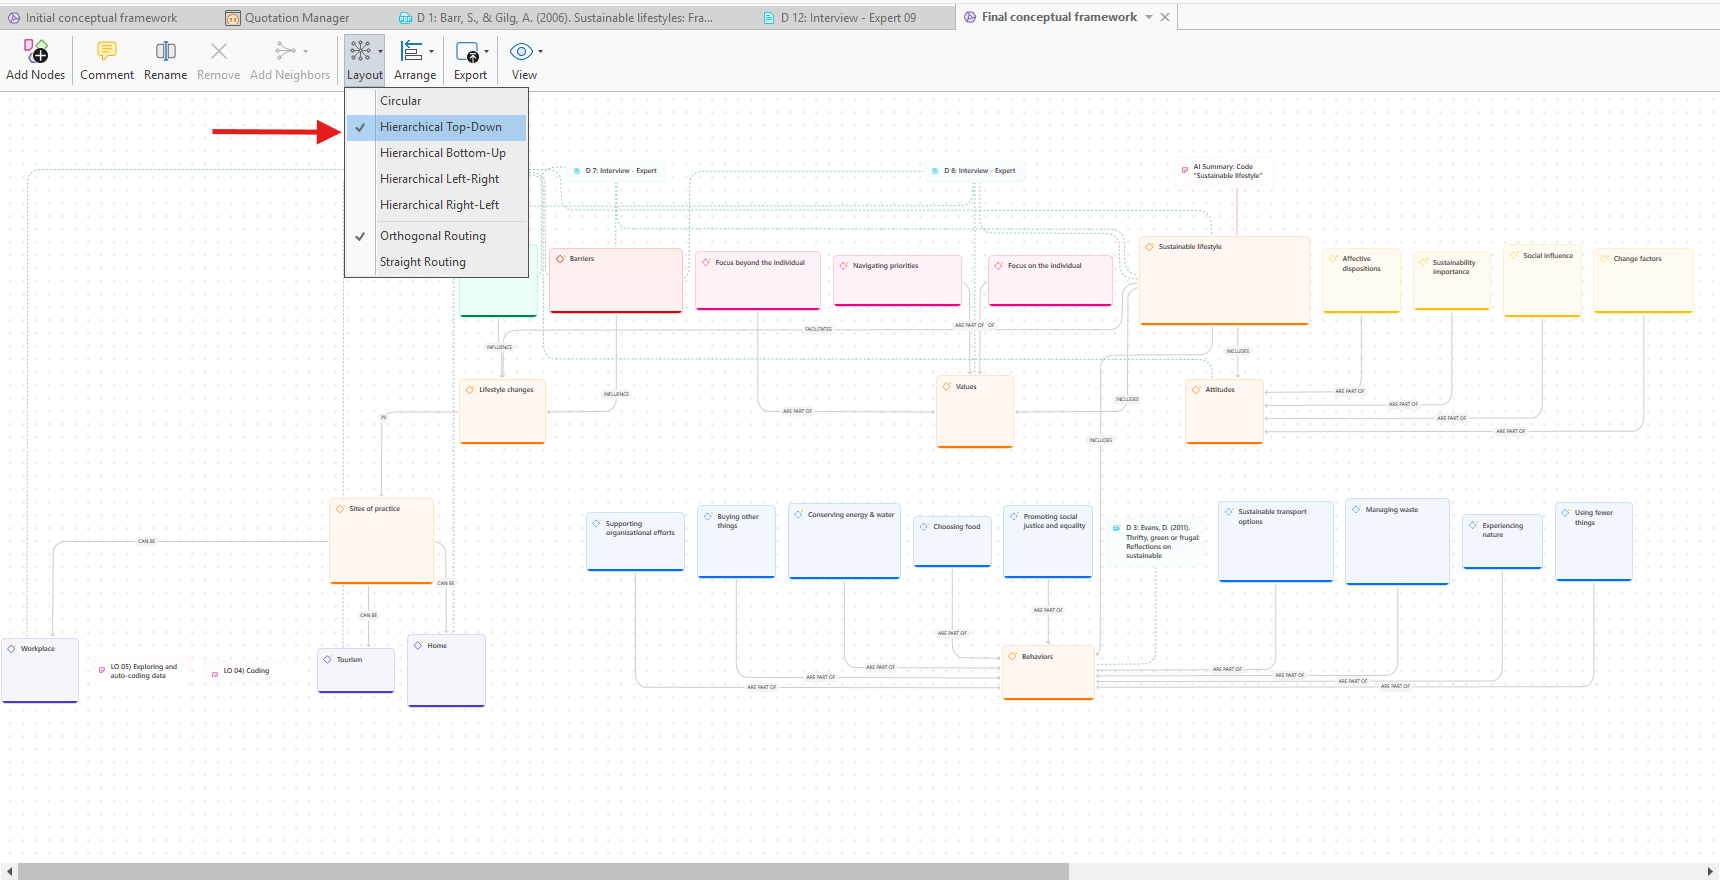
Here is an example of Hierarchical Top-Down Arrangement (slightly adjusted to fit the screen):
Arrange options
The Arrange tools help align and organize selected nodes, including:
- Align left, right, top, or bottom
- Distribute horizontally or vertically
- Bring nodes to front
- Send nodes to back
- Reset node sizes
Manual drag-and-drop positioning is also available.
Work with memos, quotations and documents in networks
Networks are not limited to codes.
You can add quotations, documents and memos directly into a network to:
- Connect evidence to concepts
- Build theoretical explanations
- Compare perspectives
- Add analytic notes alongside themes
Quotation nodes are especially useful for linking findings directly back to the original data.
Export networks
ATLAS.ti Windows
Networks can be exported as:
- PNG
- JPG
- GIF
- TIF
- BMP
- XPS
To export:
- Open the network.
-
Go to the Export tab.
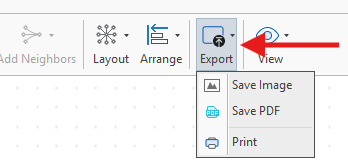
- Select an export option.

ATLAS.ti Mac
- Open the network.
- Select Export
- Choose either:
- Print Document
- Export Image...
Exporting is useful when sharing findings, creating presentations, or saving a finalized network layout.
Common issues and mistakes
- Overcrowded networks
- Very large networks can become difficult to read. Creating several smaller thematic networks is often easier to manage.
- Using too many relationship types
- Too many custom relationships can make networks confusing. Keep relationship naming clear and consistent.
- Forgetting to export layouts
- Some routing and layout views are temporary. Export important network views if you want to preserve a specific visual arrangement.
- Trying to show everything in one network
- Complex projects are usually easier to understand when separated into multiple connected networks.
When to contact support
Contact support if:
- Networks fail to open
- Nodes cannot be linked
- Export options are unavailable
- Network layouts appear broken
- Performance becomes slow with large networks