
How to analyze word frequencies in ATLAS.ti
Key takeaways
- The Word Frequencies tool helps identify the most common words in your data.
- Results can be displayed as a word cloud, tree map, or word list.
- You can analyze documents, quotations, codes, document groups, and code groups.
- ATLAS.ti Windows and Mac include a dedicated Word Frequencies tool.
- ATLAS.ti Web offers a similar exploratory feature through Concepts.
Who this article is for
This article is for ATLAS.ti users who want to explore patterns, themes, and frequently used terms in qualitative data.
What is the Word Frequencies tool?
The Word Frequencies tool analyzes your selected data and shows which words appear most often.
This can help with:
- Exploratory content analysis
- Identifying recurring topics
- Discovering themes or keywords
- Comparing language across datasets
- Finding patterns before coding
Results can be displayed as a world cloud, a tree map and a word list.
The size of words in the visualizations reflects how frequently they occur in the selected data.
Use Word Frequencies in ATLAS.ti Windows and Mac
Start a Word Frequencies analysis
You can analyze:
- Documents
- Quotations
- Codes
- Document groups
- Code groups
Method 1: From selected items
- Select one or more documents, codes, quotations, or groups.
- Right-click the selection.
- Select Analysis > Word Frequencies / Show Word Frequencies
Method 2: From the top menu
Windows: Search & Code > Word Frequencies
Mac: Analysis > Word Frequencies
Then select the items you want to analyze.
You can also access Word Frequencies directly from entity managers or document toolbars.
Switch between visualizations
The toolbar allows you to switch between different result views:
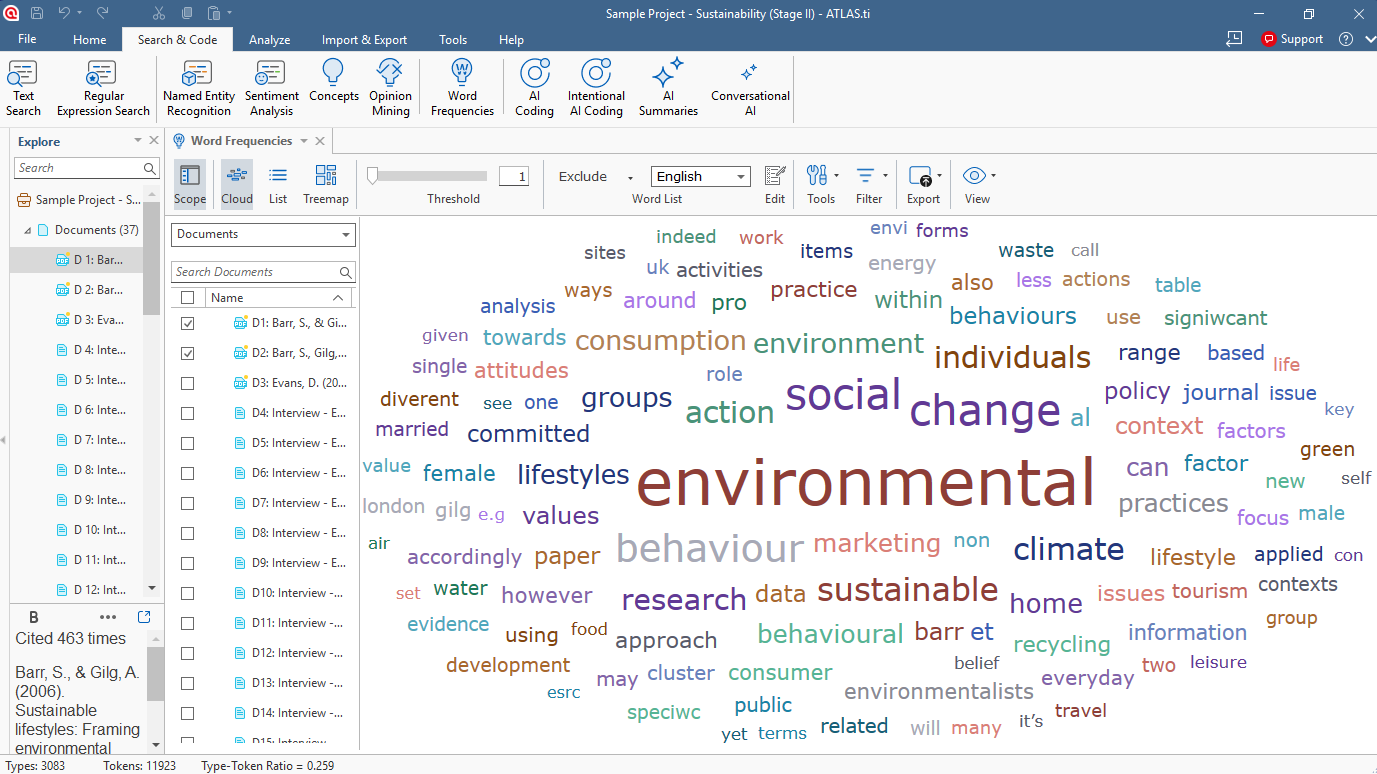
Word cloud
Displays words visually based on frequency. Larger words appear more often in the data.
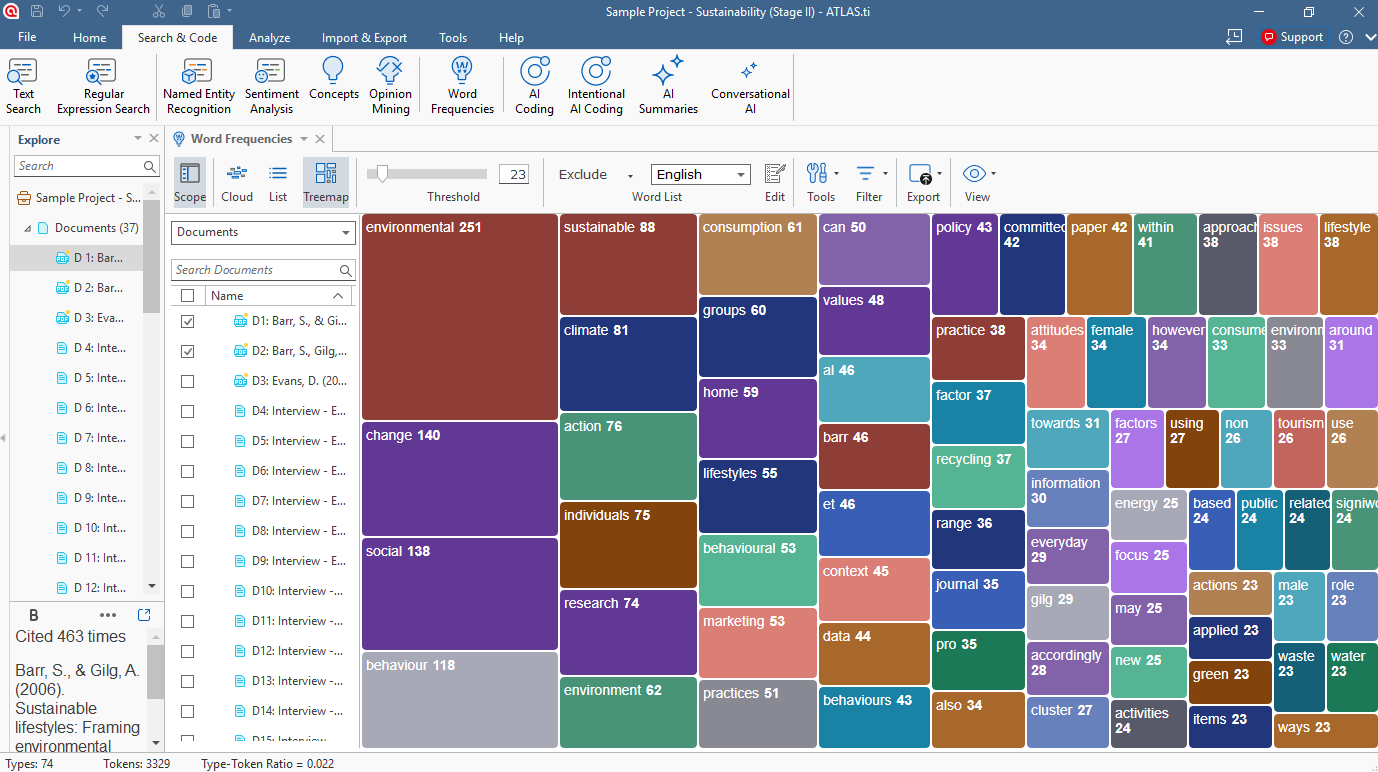
Tree map
Shows word frequencies as grouped rectangles, useful for comparing relative proportions.
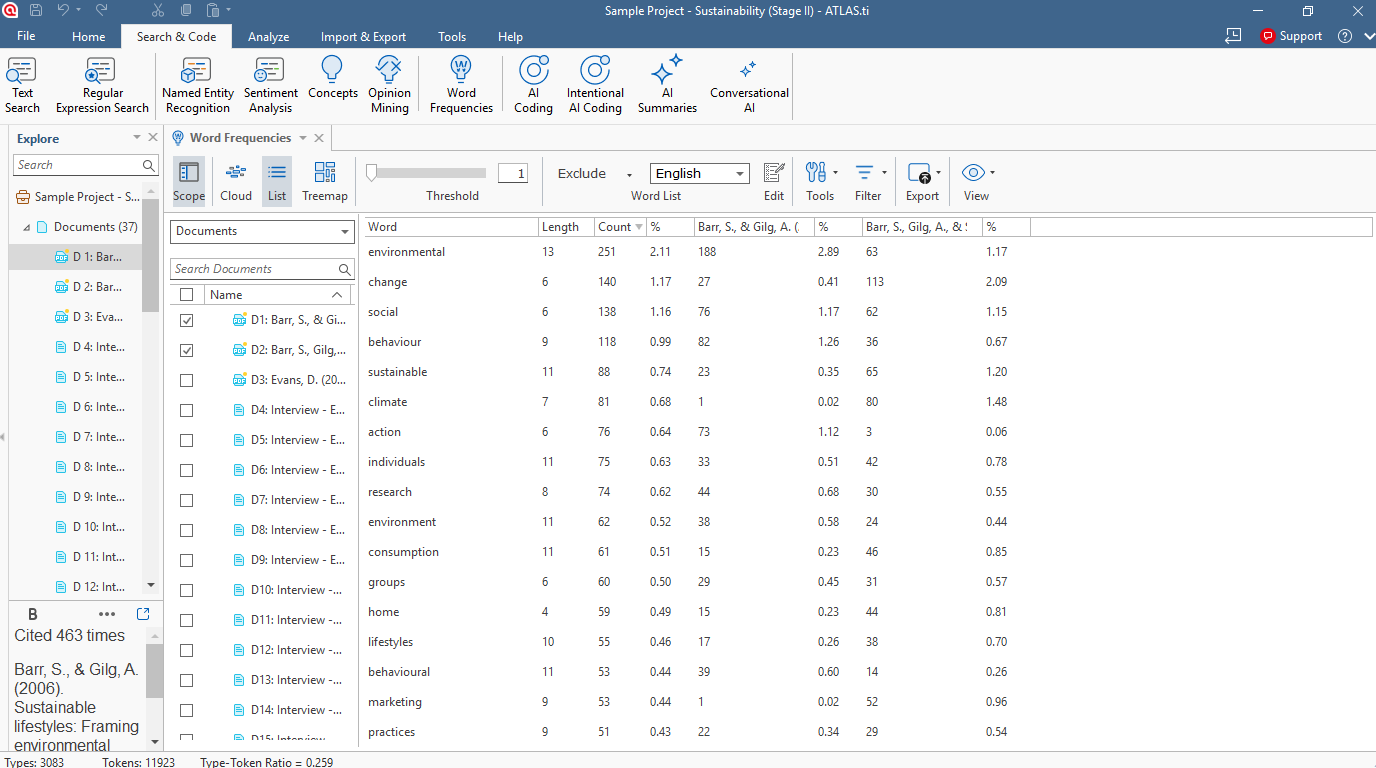
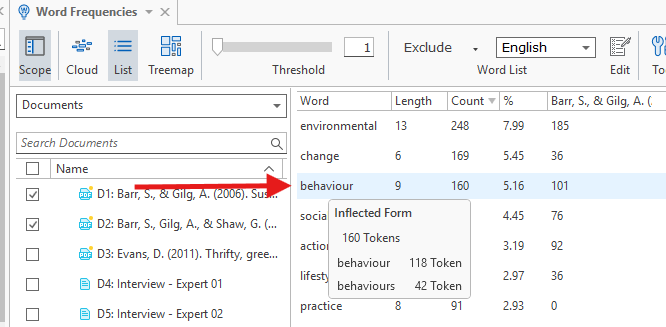
Word list
Displays words in a sortable list with counts and percentages.
When hovering over a word, ATLAS.ti shows the number of occurrences for that word.
Adjust the analysis scope
After generating the results, ATLAS.ti helps you to refine the analysis.
You can:
- Add or remove documents
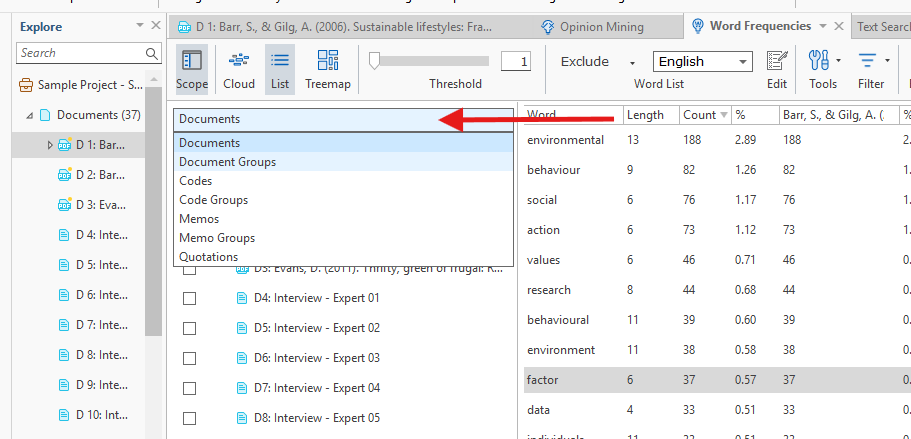
- Change the entity type
- Filter by search terms
- Limit the scope to specific codes or quotations
Available entity types include: Documents, quotations, codes, document and code groups, memos and memo groups.
Customize Word Frequencies results
ATLAS.ti includes several options to refine the analysis.
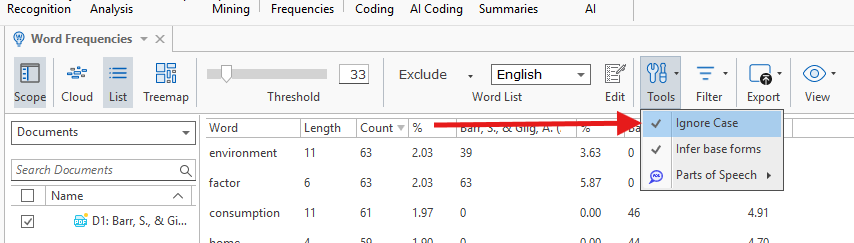
Ignore case
Counts uppercase and lowercase versions of a word as the same word.
Example:
- “Environment”
- “environment”
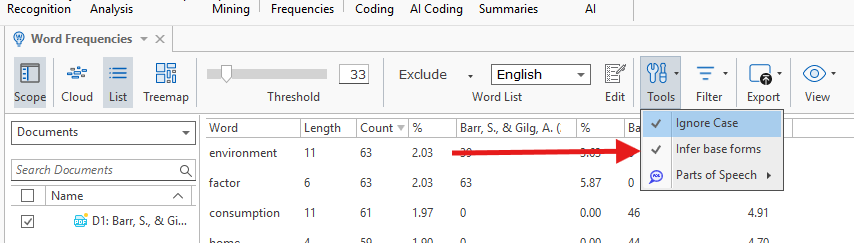
Infer base forms
Combines grammatical variations into one base word.
Example:
- “building”
- “buildings”
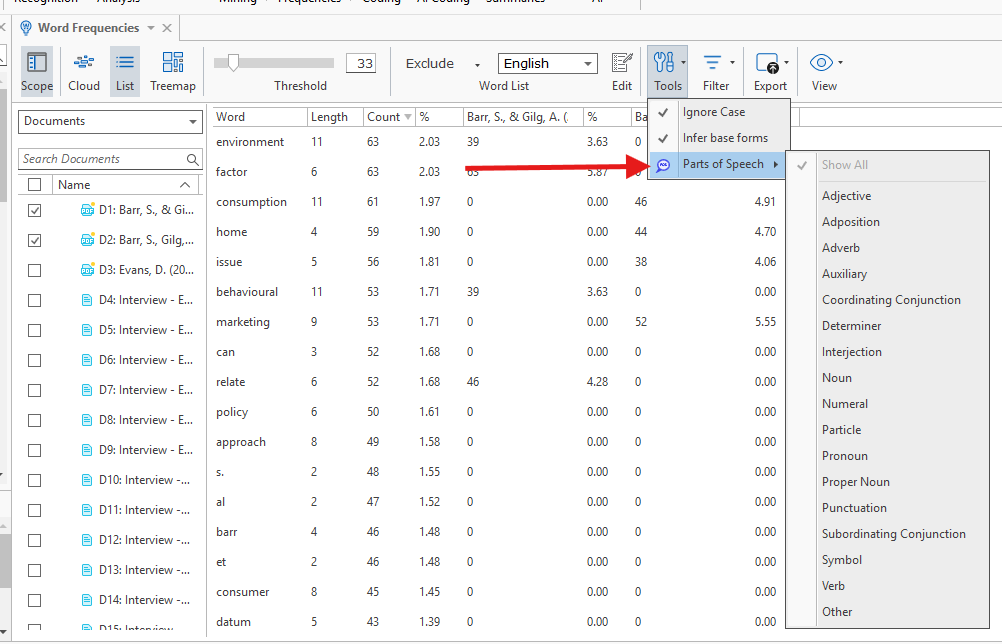
Parts of speech
Filter results by grammatical categories such as:
- Nouns
- Adjectives
- Pronouns
- Numerals
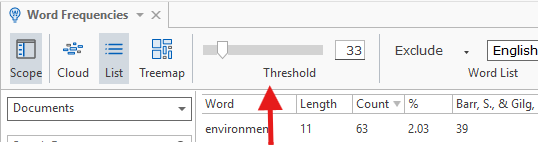
Threshold slider
Control the minimum word frequency required for words to appear in the visualization.
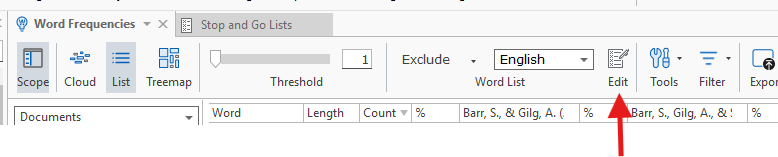
Stop lists and go lists
You can:
- Exclude common filler words
- Add custom stop words
- Focus only on selected terms
ATLAS.ti includes predefined stop lists in multiple languages, but you can always click on Edit to create your own list.
Find words in context
You can explore how words are used in the original data.
Windows and Mac
Double-click a word in the word list or tree map to:
- Open the word in context
- See where it appears in the data
- Review surrounding passages
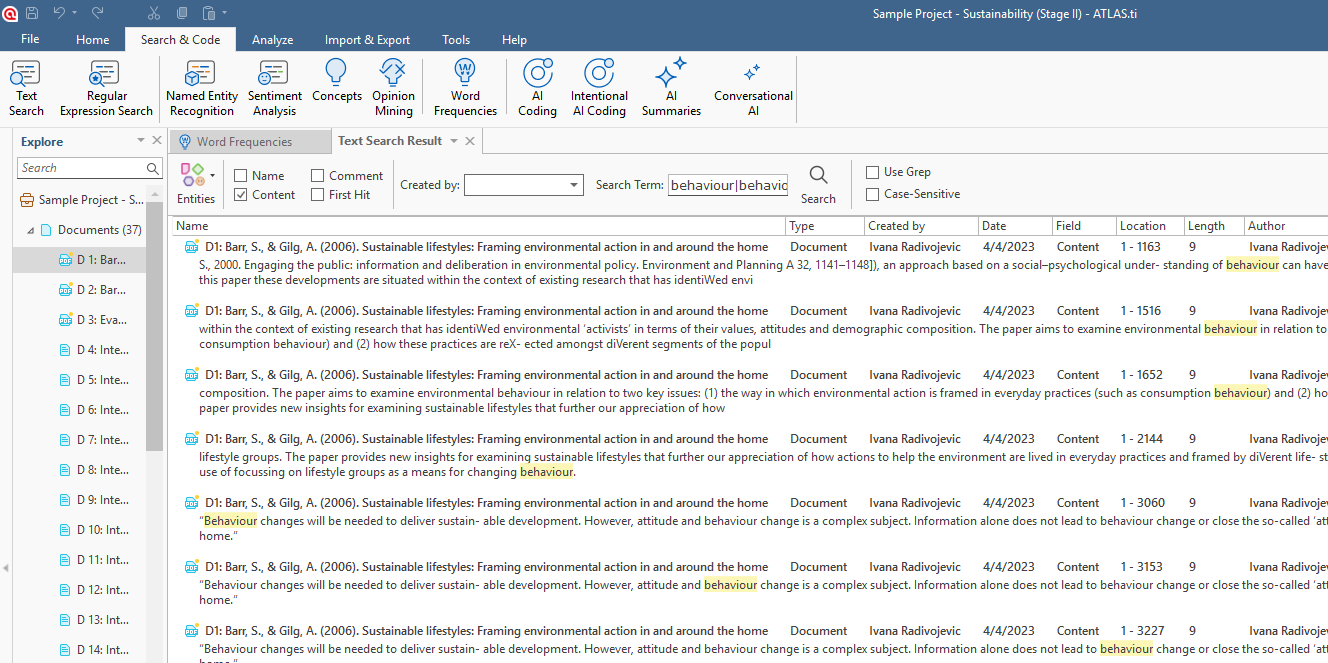
Once you double-click on the word - a new Text Search Result window will show you all instances of this word being used.
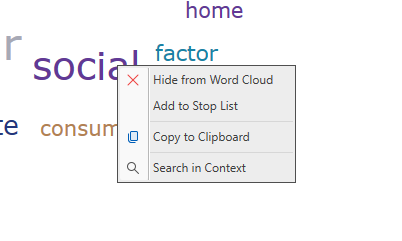
You can also right-click words to:
- Search in context
- Copy the word
- Add it to a stop list
- Temporarily hide it from the cloud
Export Word Frequencies results
You can export results for reports, presentations, or further analysis.
Export options
- Excel spreadsheet
- PNG image
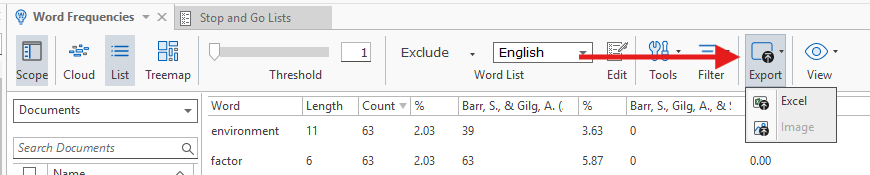
Word clouds can be saved as PNG image files, while word lists and detailed frequency data can be exported to Excel.
Word Frequencies in ATLAS.ti Web
ATLAS.ti Web does not currently include the dedicated Word Frequencies tool available in Desktop.
Instead, you can use the Concepts feature for a similar exploratory analysis experience.
Concepts helps identify recurring terms and thematic connections within your data.
Common issues and mistakes
- Including too many unrelated documents
- Large mixed datasets can produce broad or unhelpful frequency results.
- Forgetting stop words
- Without stop lists, common words may dominate the visualization.
- Interpreting frequency as importance
- Frequently used words are not always analytically meaningful. Context still matters.
- Using poorly formatted PDFs
- PDF text structure can sometimes affect word extraction and frequency counts.
When to contact support
Contact support if:
- Word Frequencies does not open
- Visualizations fail to load
- Export options are unavailable
- Words appear duplicated unexpectedly
- Results seem incomplete or inaccurate